Applies to: Datylon Online chart maker & Datylon for Illustrator
All features explained in the following article refer to the RGB color mode. Datylon for Illustrator also supports CMYK color mode. Please read more about it in this article.
Introduction
Any Datylon chart component like a bar or other data mark, axis, grid, label, text, background, etc. can be colored by simply assigning a color to it. This is called direct coloring.
The other method is coloring based on the underlying data. This is referred to as data-driven coloring and explained in another article.
Most of the features in Datylon are designed with the re-usability of charts in mind. Meaning data can be updated easily without the need for manual restyling. Therefore, data-driven coloring overrules direct coloring.
Direct coloring can be done on different levels:
- Overall, on a global level directly under the Styling tab
- On series level in Styling > Series >…
- Or even one step down on data point level in Styling > Series > All Data >...
The series-level styling overrules the global styling. Data point level overrules series. More info on working with series in this article and data point styling here.
Direct coloring options
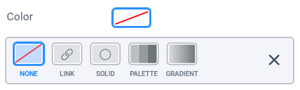
Click Color or Stroke in any section to open the Color panel.
Depending on the specific property to be colored, you have 4 possible options in the color panel for direct coloring: None, Link, Solid and Gradient. The Palette button on the top row is used for data-driven coloring only.
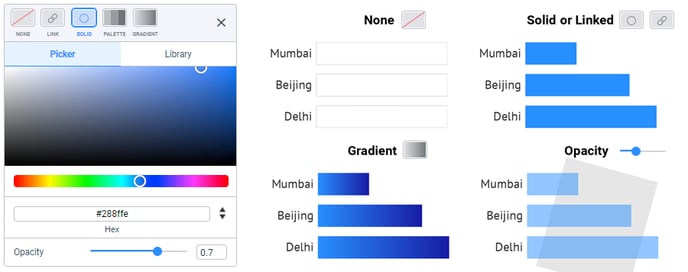
None
No color is applied. The component is transparent and therefore invisible.
Solid
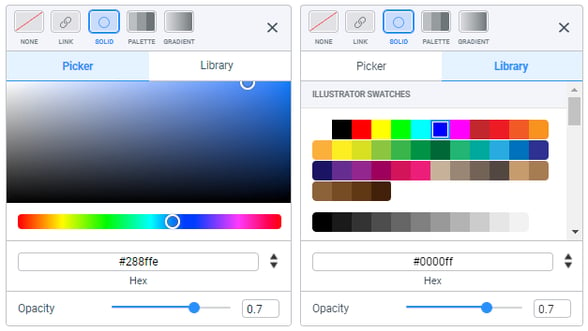
Solid colors can be selected in 3 ways:
- Straight from the color picker
- Typed in Hexadecimal (HEX), RGB or HSL
- From single swatches in pre-defined palettes in the Library tab. In Datylon for Illustrator, also the Illustrator swatches are copied to the Datylon color panel.
More on palettes in this article.
Linked
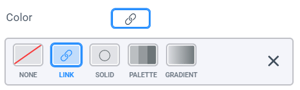
The color of some components can be linked to another, more significant, element. Examples of such components are data label text & backgrounds and most data marks.
Click the Link icon in the Datylon color panel, and the color will be linked to that of the main element e.g. bar, line, etc. Hover over it to see where it connects to.
Gradient
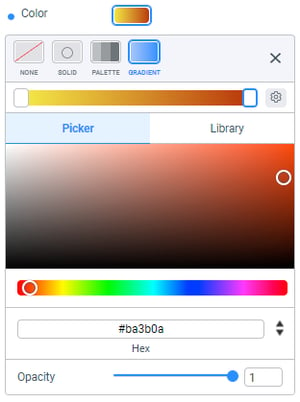
A linear gradient can be set between 2 solid colors under an angle between 0 to 90 degrees. Gradients are not supported for Stroke and Text.
The Gradient colors can be selected in 3 ways:
- Straight from the color picker
- Typed in Hexadecimal (HEX), RGB or HSL
- From single swatches in pre-defined palettes in the Library tab
Opacity
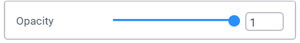
Opacity can be set to a solid color, a color swatch of the color Library tab or a gradient. This by means of a slider or numerically with a value between 0 (transparent) and 1 (opaque), i.e. 0.55.