Some Datylon charts allow for visualizing multiple series.
The following Datylon charts support multiple series:
- Bar Chart,
- Line Chart,
- Area Charts,
- Heatmaps.
How to create series
The series are created under the Binding tab.
Click on the + sign under Binding > Series to add a serie. You can delete series by clicking on the - sign next to the series name.
Change the order of series
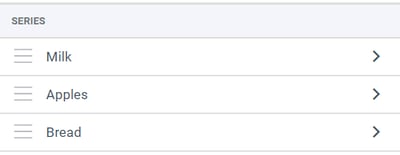
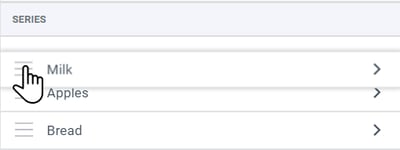
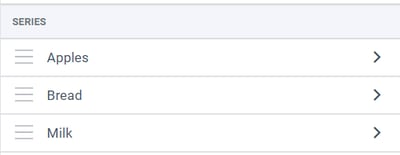
You can change the order of the series as they appear in the chart by dragging them up and down in Styling > Series. Note that if you have bound a color palette to the series, this also means the palette is reassigned according to the new series order.
Styling and Reset styling of series
In Datylon for Illustrator, you can style elements of multiple series globally, but many properties can also be set per series separately under Styling > Series.
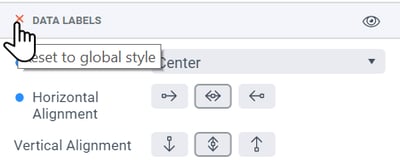
Changing a property in Styling > Series will overwrite the global settings, only for that specific series.
To indicate that the global settings are overwritten, you'll find a blue dot in the property's section name, next to the specific property that is changed.
Click the blue dot to reset the local series property back to a global property again.