Datylon for Illustrator & Datylon web app
Datylon Treemap
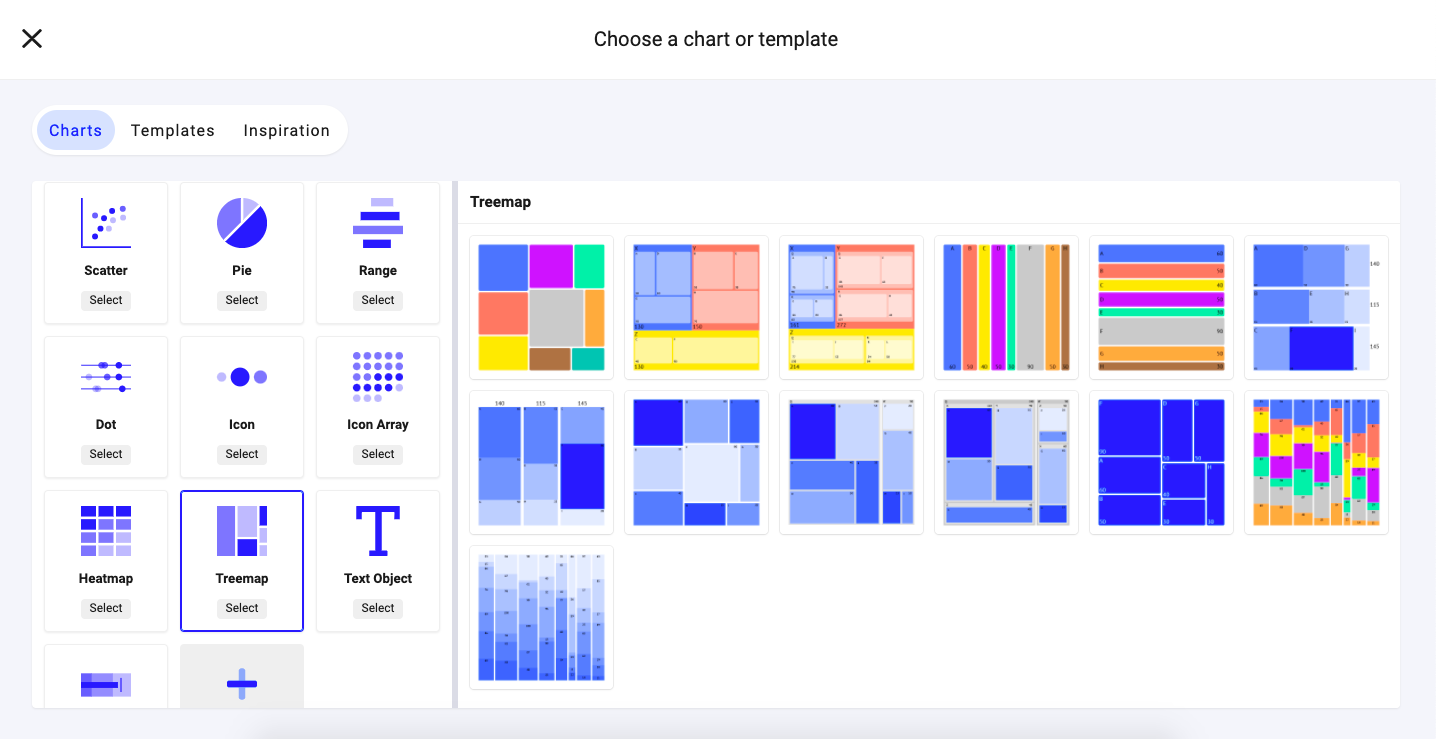
Treemap has been a chart type topping many users’ wishlist. Now we are happy to announce we’ve added it to the Datylon chart library! If you need to visualize quantities in a hierarchical structure, and yet in a compact way, the Datylon Treemap is your ally.
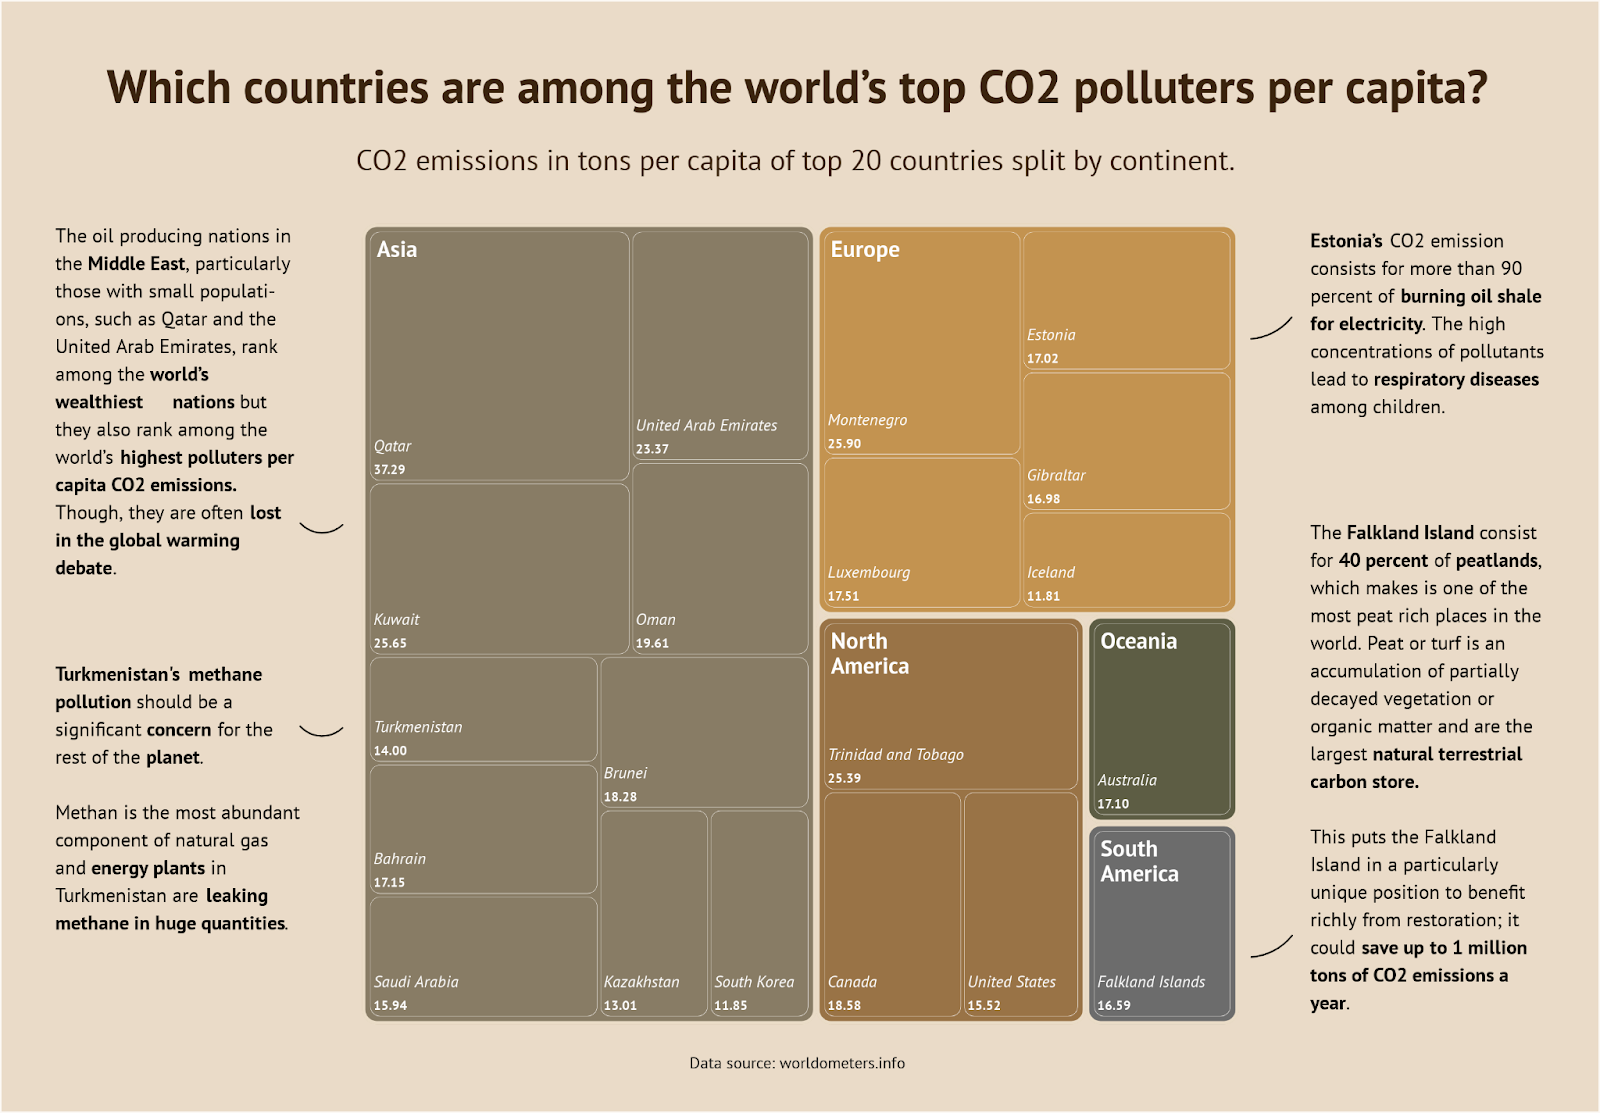
Just select the Treemap in the Datylon editor, choose one of the defaults, add your data, and design the Treemap using the many color and styling options available. More info about the Datylon Treemap properties and how to apply them can be found here.
Stay tuned as we will publish more information about the Treemap soon. In the meantime, find some nice samples on our Inspiration page for you to use online or in Datylon for Illustrator.
Datylon Range chart improvements
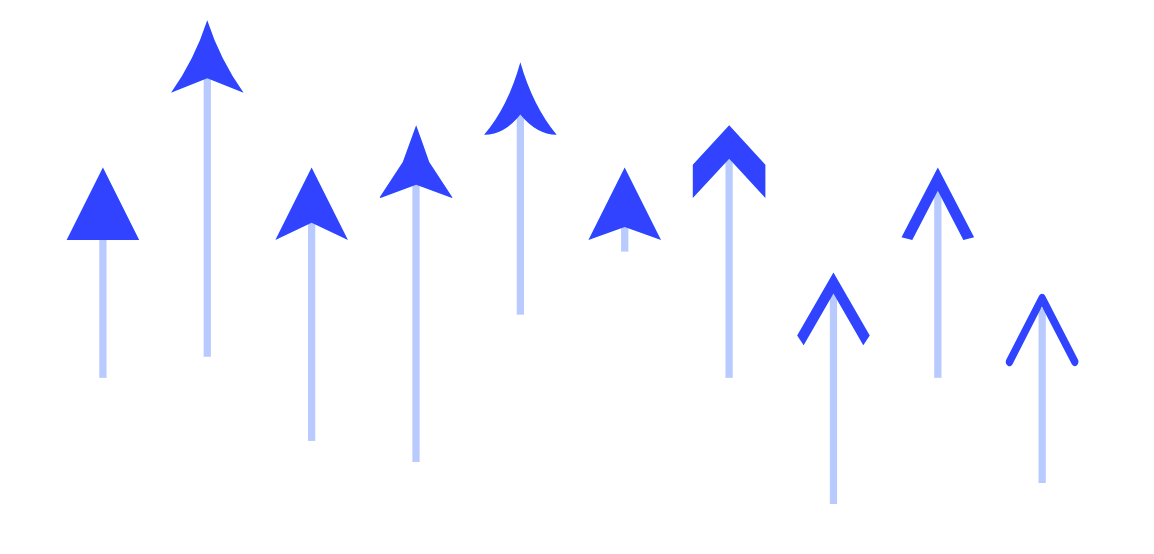
The Datylon Range chart serves as the basis for an Arrow chart and is therefore extended with a wider choice of arrowheads. Use the arrowhead which matches best with your personal styling and brand.
Select a Range chart and go to Styling > Ranges > Arrowhead > Icon both in positive and negative ranges, and choose the right arrow for your design. To save time when editing colors, you can also link the color of the arrowhead to the color of the range stroke.
Read more about Range chart properties, or how to make an arrow chart.
Datylon for Illustrator
Download here the latest version of Datylon for Illustrator.