INTRODUCTION
A Treemap helps you to visualize quantities in a hierarchical structure, and yet in a compact way.
A Datylon treemap consists of a minimum 1 and maximum 3 hierarchical levels, called “Level” in the Datylon interface. At least one Level and the Size property should be bound for a Treemap to be drawn.
The highest Level divides the plot area into cells based on unique categories. The size of each cell represents the sum of values that corresponds to the same category.
Lower Levels split the higher-level cells into smaller cells.
The lowest bound Level creates cells at the size of every value bound to the Size property. If only one Level is bound, it will behave as the lowest level.
Many properties in the DATA section can be set overall for the whole chart, but also separately on each data point of the lowest level. See data point styling for more details.
Binding Tab
1 Dataset
2 Series
Styling Tab
GENERAL
1 Position and Size
2 Appearance
DATA
3 Level 1, 2 & 3
Binding Tab
Dataset>
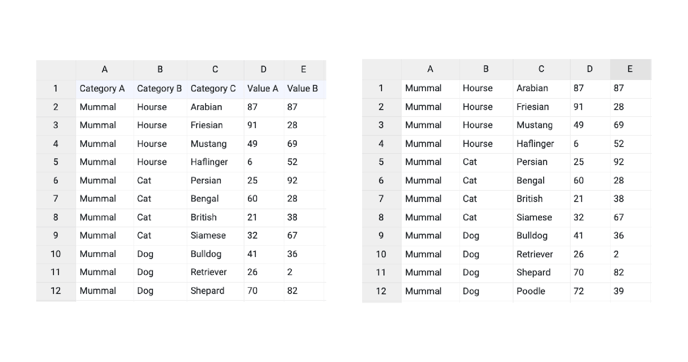
| First row (column) are headings |
When enabled, the first row (column) of the dataset are headings. When disabled, the first row (column) of the dataset is included in the data range. |
 |
| Data is in | Select if data series are structured in rows or columns. | 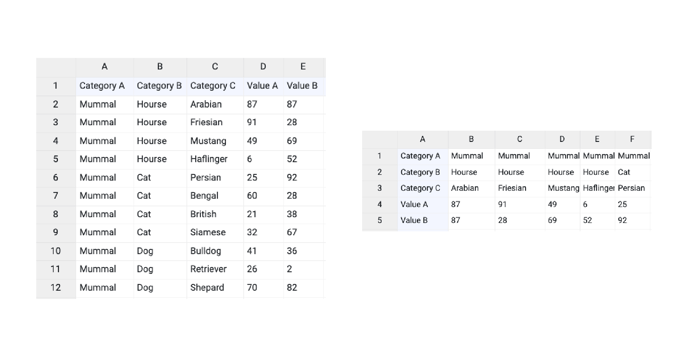 |
Series>
| Name | Text field to name the Series. By default it is set to “New series 1”. Treemap only supports one series. | 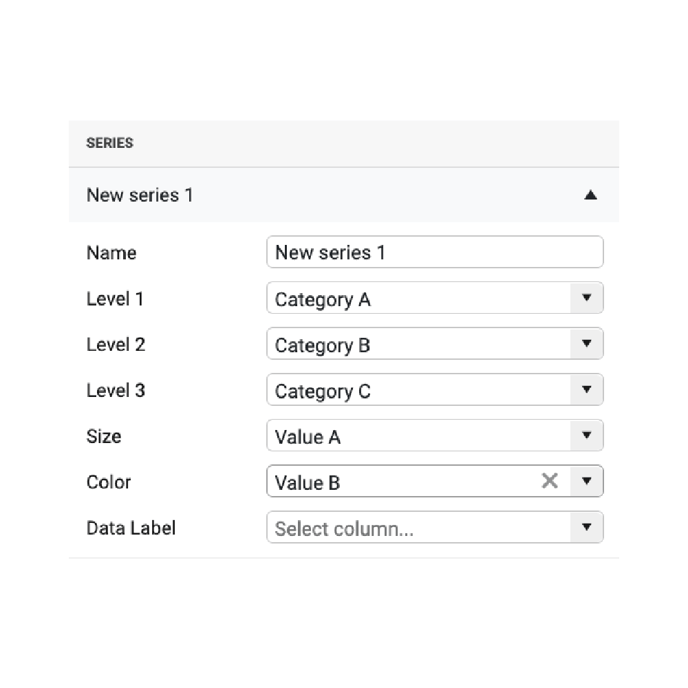 |
| Level 1 | Used to bind the first level of a treemap | 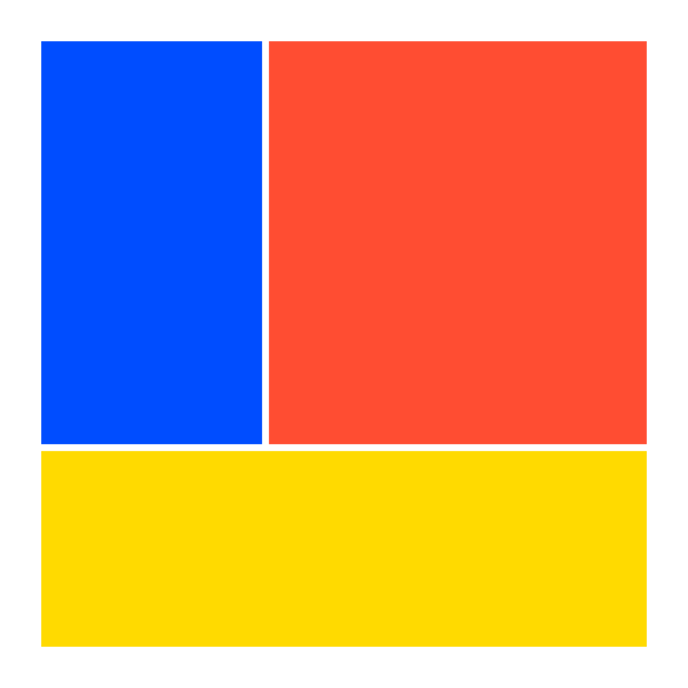 |
| Level 2 | Used to bind the second level of a treemap | 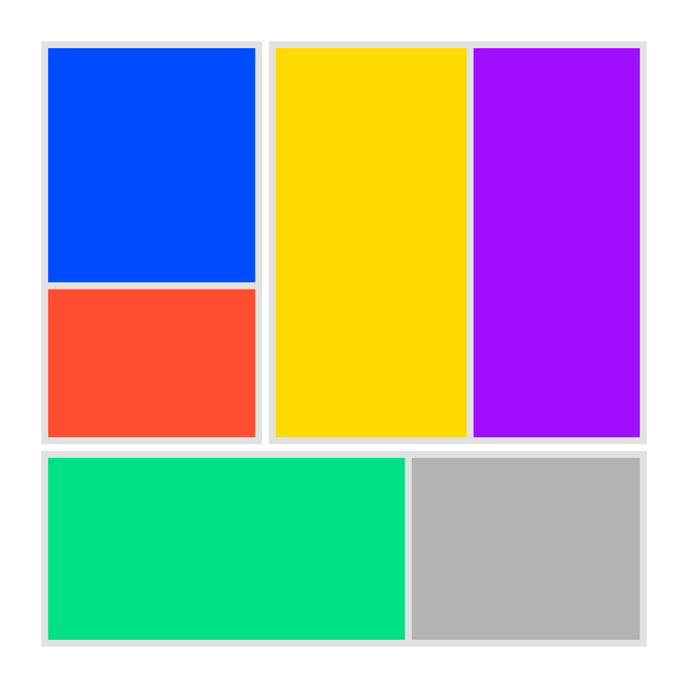 |
| Level 3 | Used to bind the third level of a treemap | 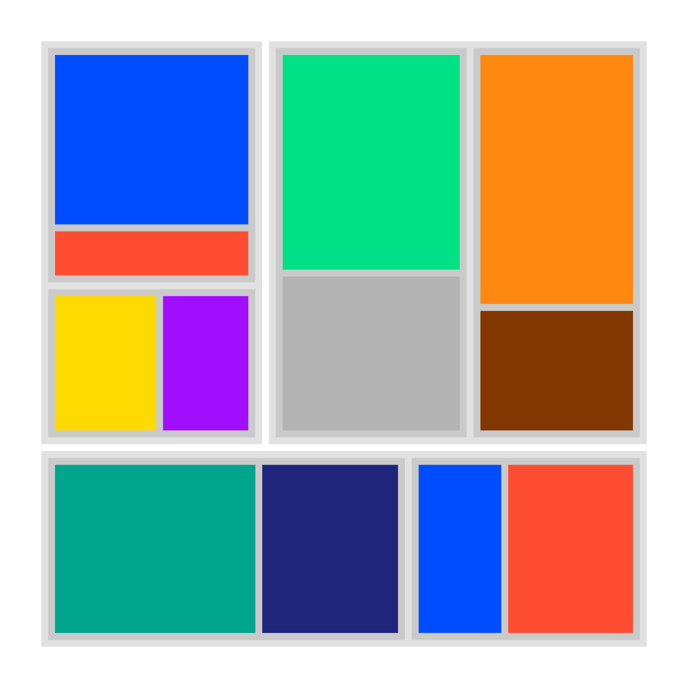 |
| Size | Used to bind values from the data to the size of a cell. Every row(column) in the data is represented by one cell. Size binding is obligatory. | 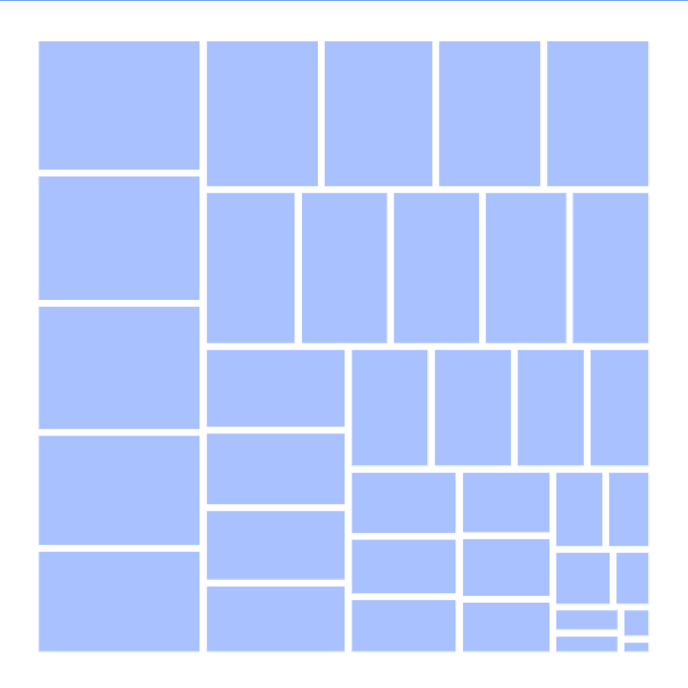 |
| Color |
Can be used to bind the color to the lowest available level. The bound column/row can be represented by categorical or numerical values. By default, it’s formatted as a categorical value. The type of data can be adjusted in the Formatting tab. |
 |
| Data Label | Can be used to bind labels to the lowest available level. | 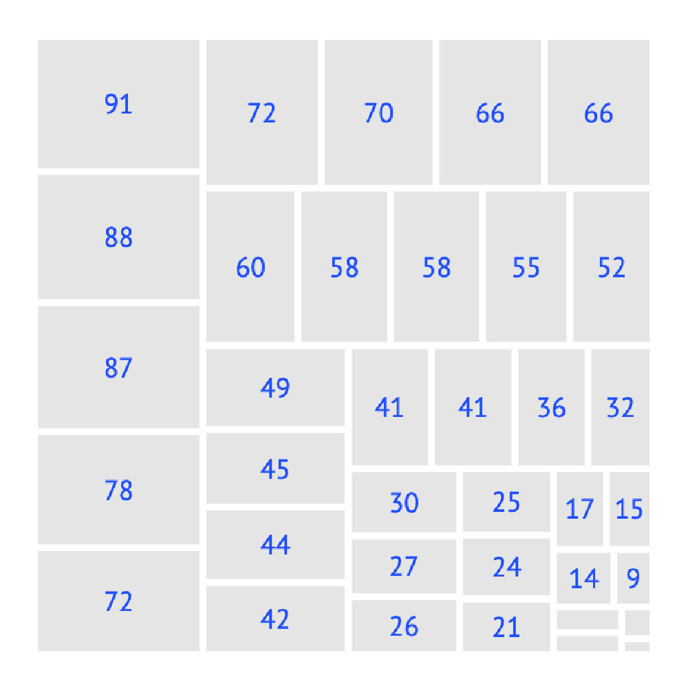 |
Styling Tab
DATA
Level 1, 2 & 3
Cell>
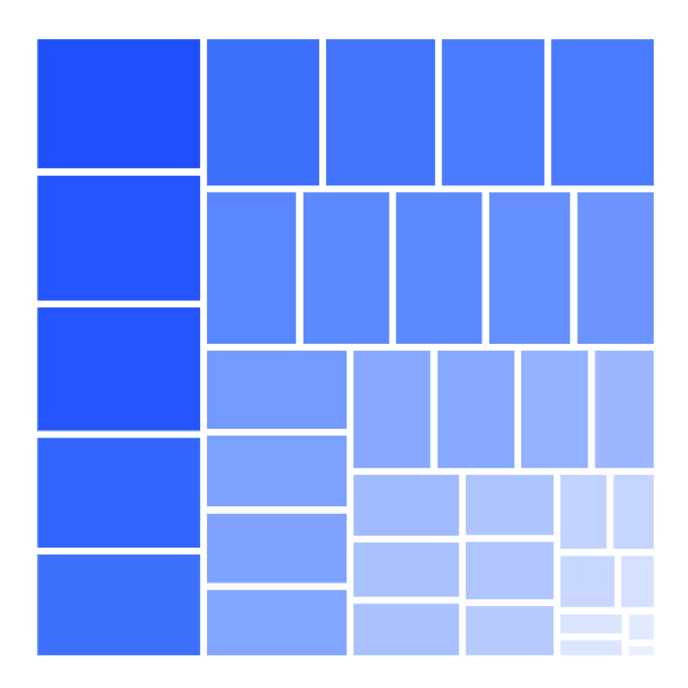
| Color |
Sets the color of the cells. For the Treemap, the most useful color options are sequential and diverging palettes. To color multiple cells, the cell colors should be linked to a palette. The colors of the higher Levels are defined by the categories. The colors of the lowest level are defined by the data that is bound to Color. See more on color here. |
 |
| Stroke | Sets the stroke color and weight of the cell. Click the cogwheel to access dashed stroke properties and stroke type. | 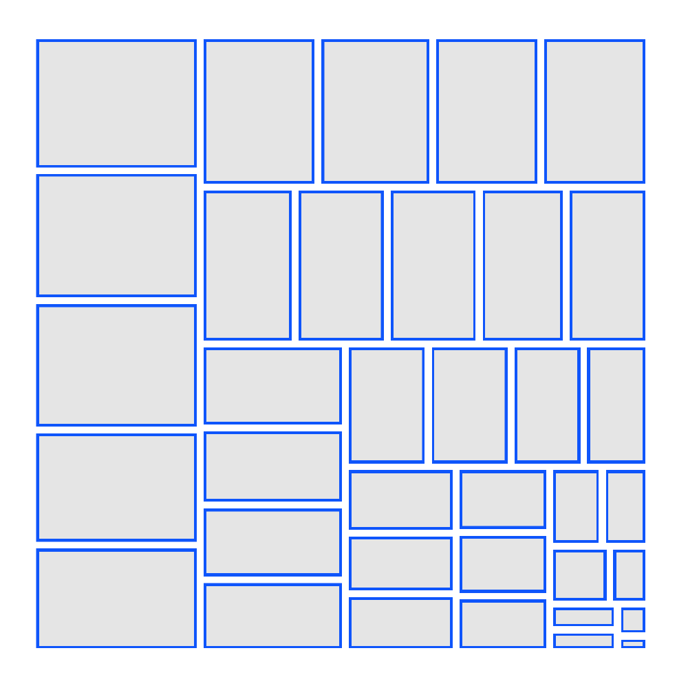 |
| Stroke > Cogwheel > Type | Allows to use two types of stroke placement:
|
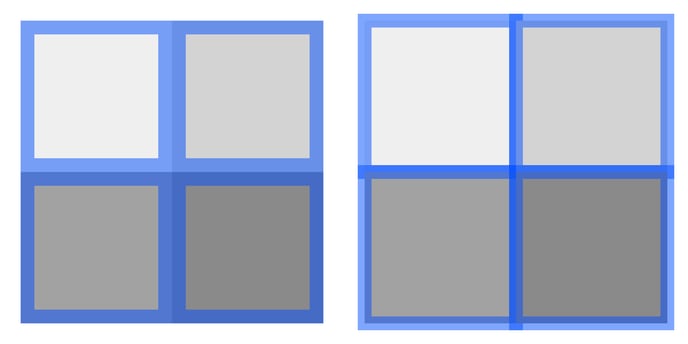 |
| Stroke > Cogwheel > Corner |
Sets the type of the corner. There are two types available: Miter and Round. Options are available only if type is set tot Center. |
 |
| Stroke > Cogwheel > Dash |
Allows changing the length and gaps between the dashes. | 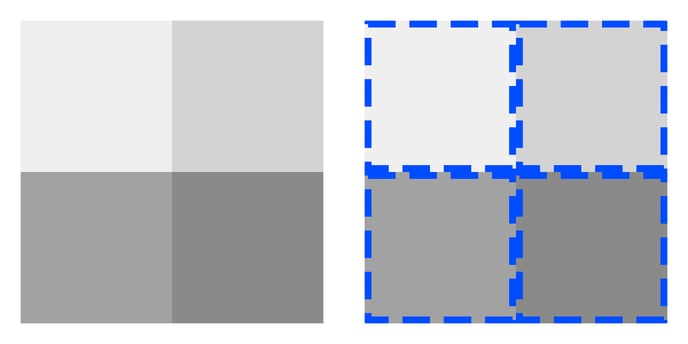 |
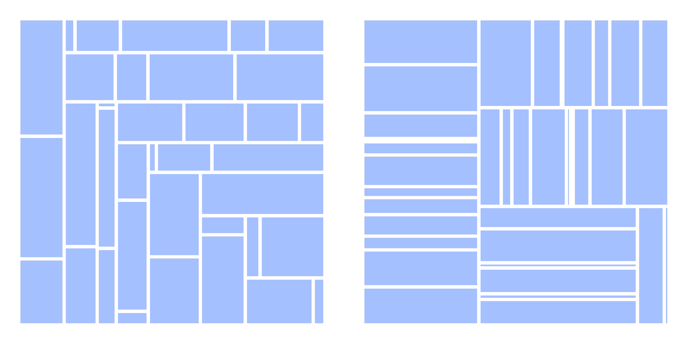
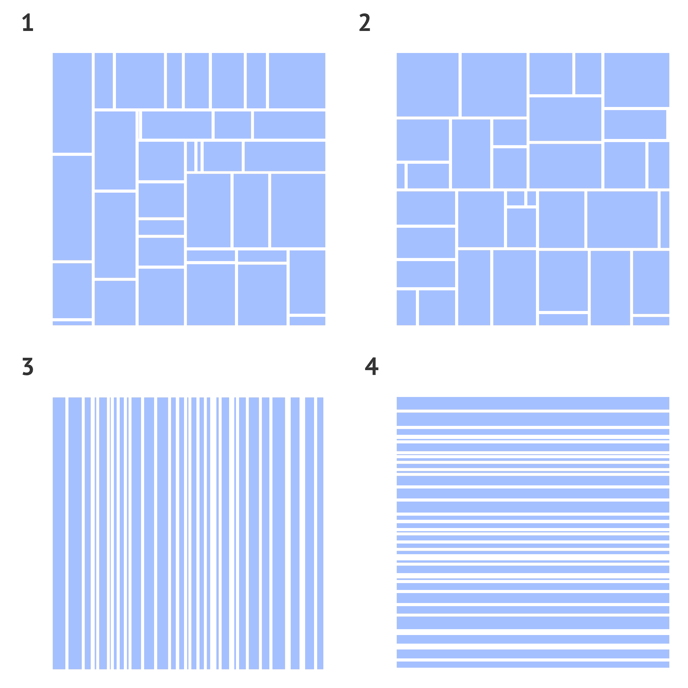
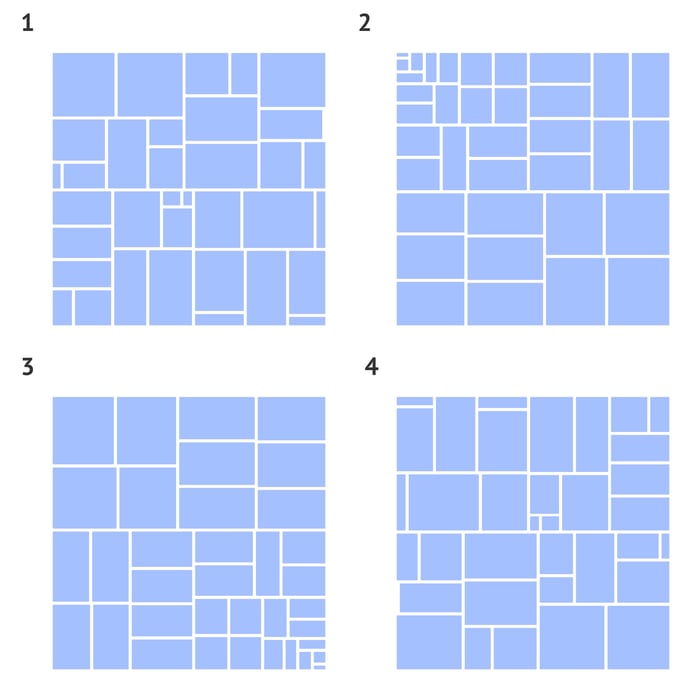
| Tiling |
Sets the way cells are arranged. There are five types: Cells approximate to a given aspect ratio set in the “Ratio” property. 2. Treemap Binary Cells are placed according to binary tree structure rules. 3. Treemap Slice All the cells are separated vertically 4. Treemap Dice All the cells are separated horizontally 5. Treemap Slice Dice The cells are separated vertically or horizontally based on binary tree structure rules. |
 |
| Ratio | Sets the approximated height/width ratio of the cells. If a Ratio is set to 2, the height/width ratio of the drawn cells will be approximated to 2:1 or 1:2. Available only when “Treemap Squarify” Tiling is selected. |
|
| Sorting |
Sorts the cells based on Size value and places them starting from the top left corner: 2. Ascending 3. Descending 4. Reverse |
 |
| Outer Padding | Sets the padding for a group of cells related to the same level. Available for Level 1 and 2. Separate settings for each corner can be applied by clicking on the cogwheel. |
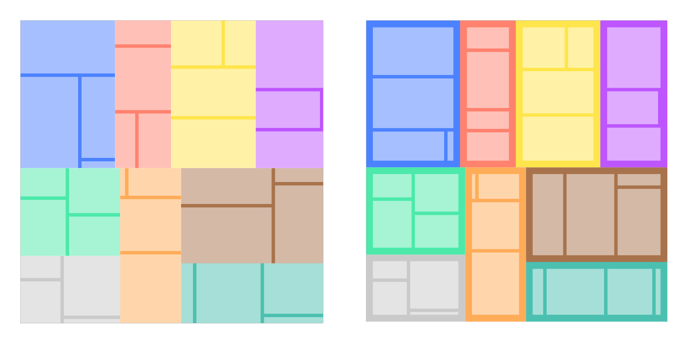 |
| Inner Padding | Sets the padding between the cells of the corresponding level. | 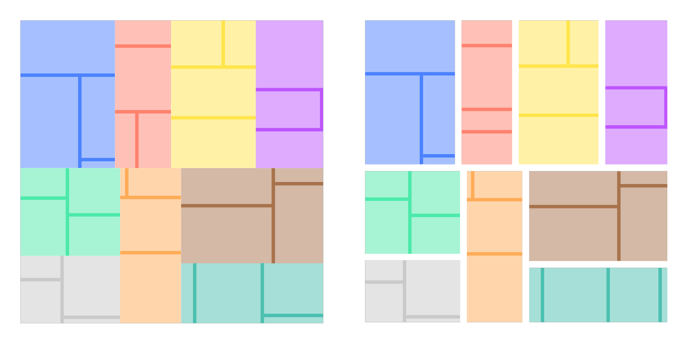 |
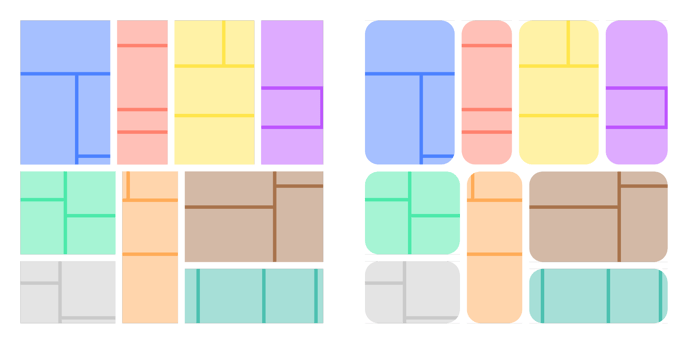
| Corner Radius |
Applies rounded corners to the cells. Separate settings for each corner can be applied by clicking on the cogwheel. |
 |