Datylon charts are often used in multi-page reports produced with Adobe InDesign. To fully enjoy the power of the Adobe workflow combined with Datylon, follow the steps and instructions below.
The InDesign menus refer to Adobe InDesign CC 2019, 14.0.1, Dutch language.
-
Design your layout in InDesign as you usually do. Use placeholders where the charts need to be inserted.
-
Open Adobe Illustrator and create Datylon charts with Datylon for Illustrator.
-
Place each Datylon chart on a separate artboard, but preferably in one document unless you have many charts (50+). In that case, it is best to split them into batches of 50 or less over separate Illustrator documents.
-
Name the artboards logically, as the artboard name is the identifier when they are placed in InDesign. Also, name the Datylon charts and data sheets properly to facilitate re-usability. This is done in the Datylon header by clicking on the data sheet and chart names.
-
Make the charts at the right size in Illustrator. As scaling them in Indesign will scale them as an image. Meaning fonts and strokes etc. will be scaled too, not as in Datylon for Illustrator where chart properties will keep their size when scaling the chart area, as they should do. It could be helpful to create the Artboards In Illustrator at full width (= the InDesign page width) to have a reference.
-
If the charts need to be aligned above or next to each other, it is best to work with fixed margins. Use Styling > Position And Size > Plot Area > Fixed Position, instead of Autofit.
-
-
Insert the Datylon charts into the InDesign layout
-
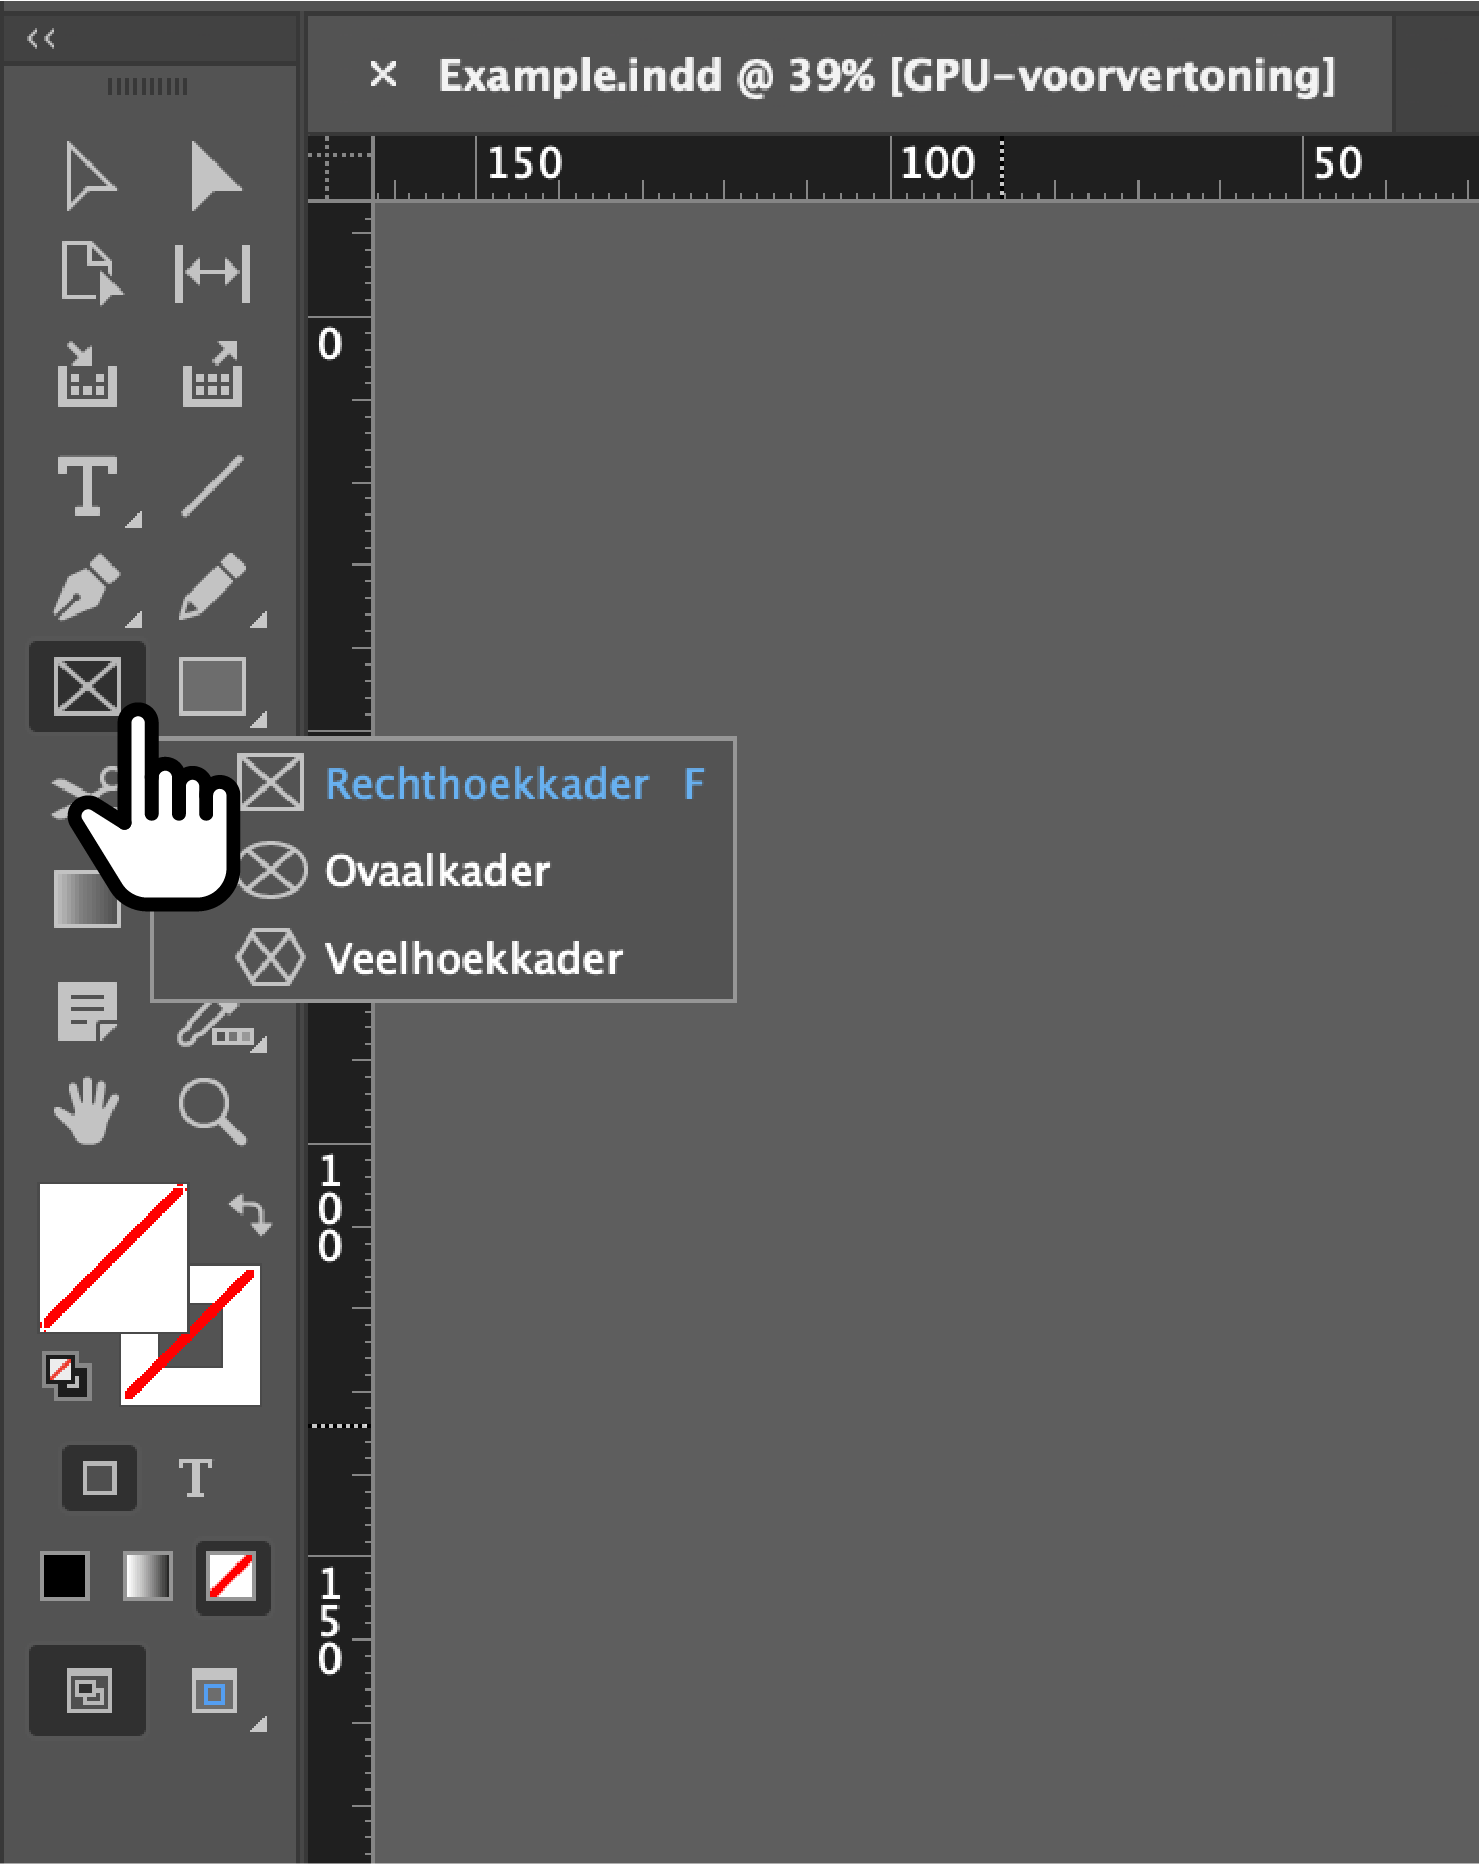
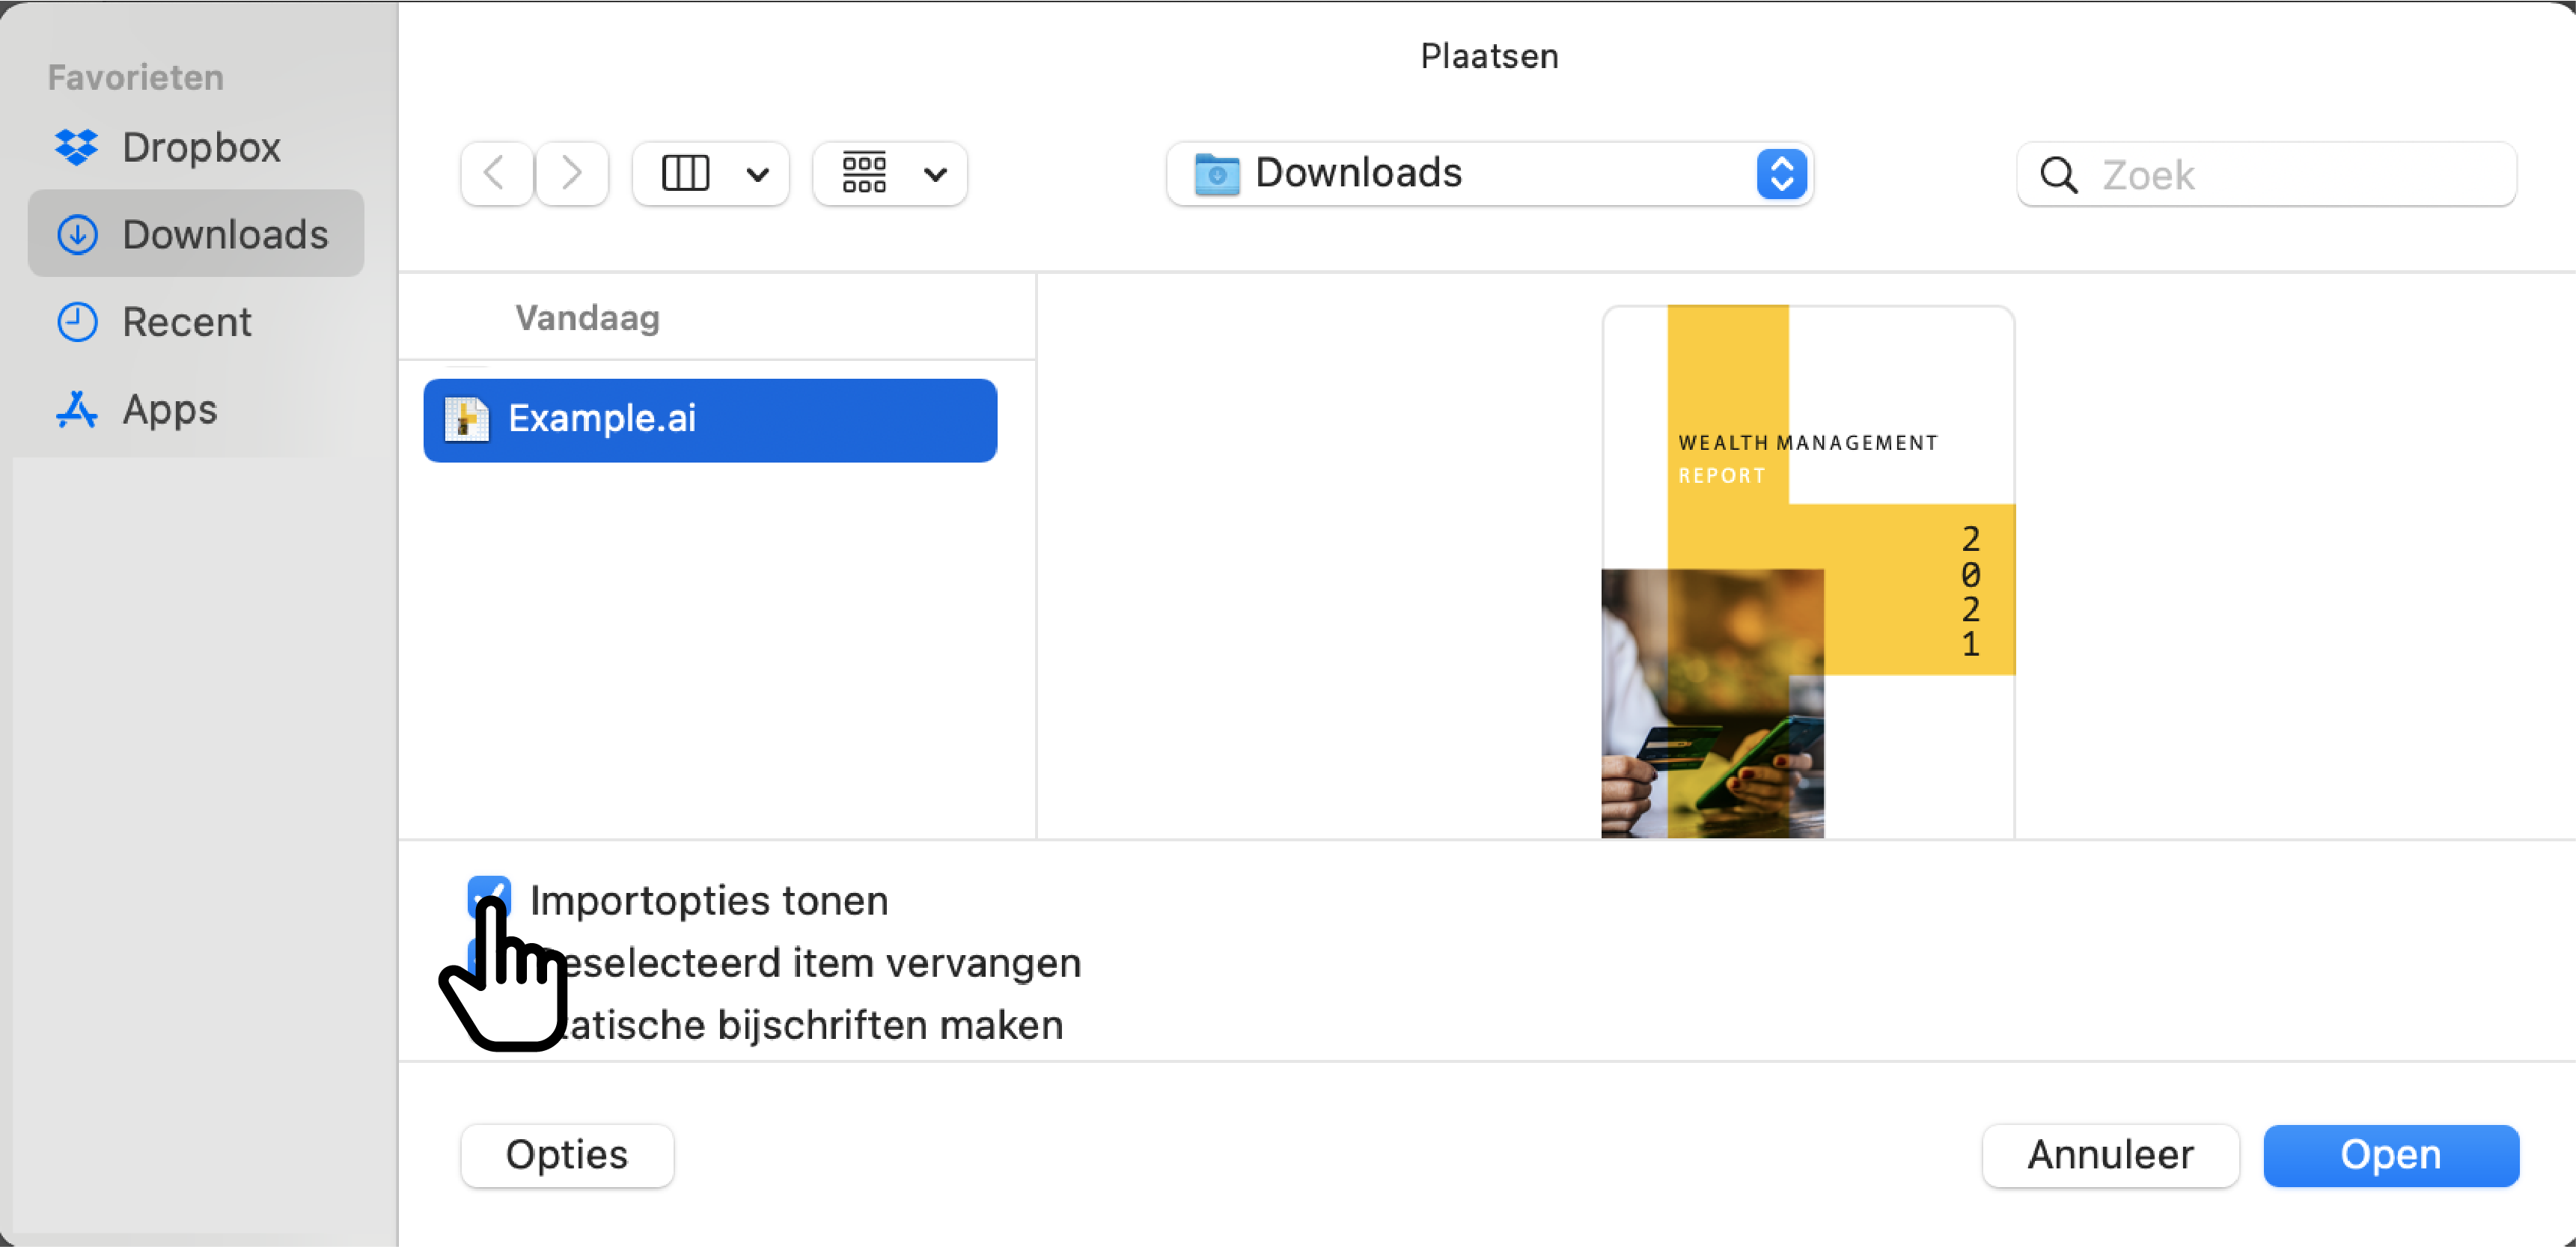
Open InDesign. Select the relevant placeholder image and then use InDesign's Place command. Select and place the native Illustrator file containing the Datylon charts.
-
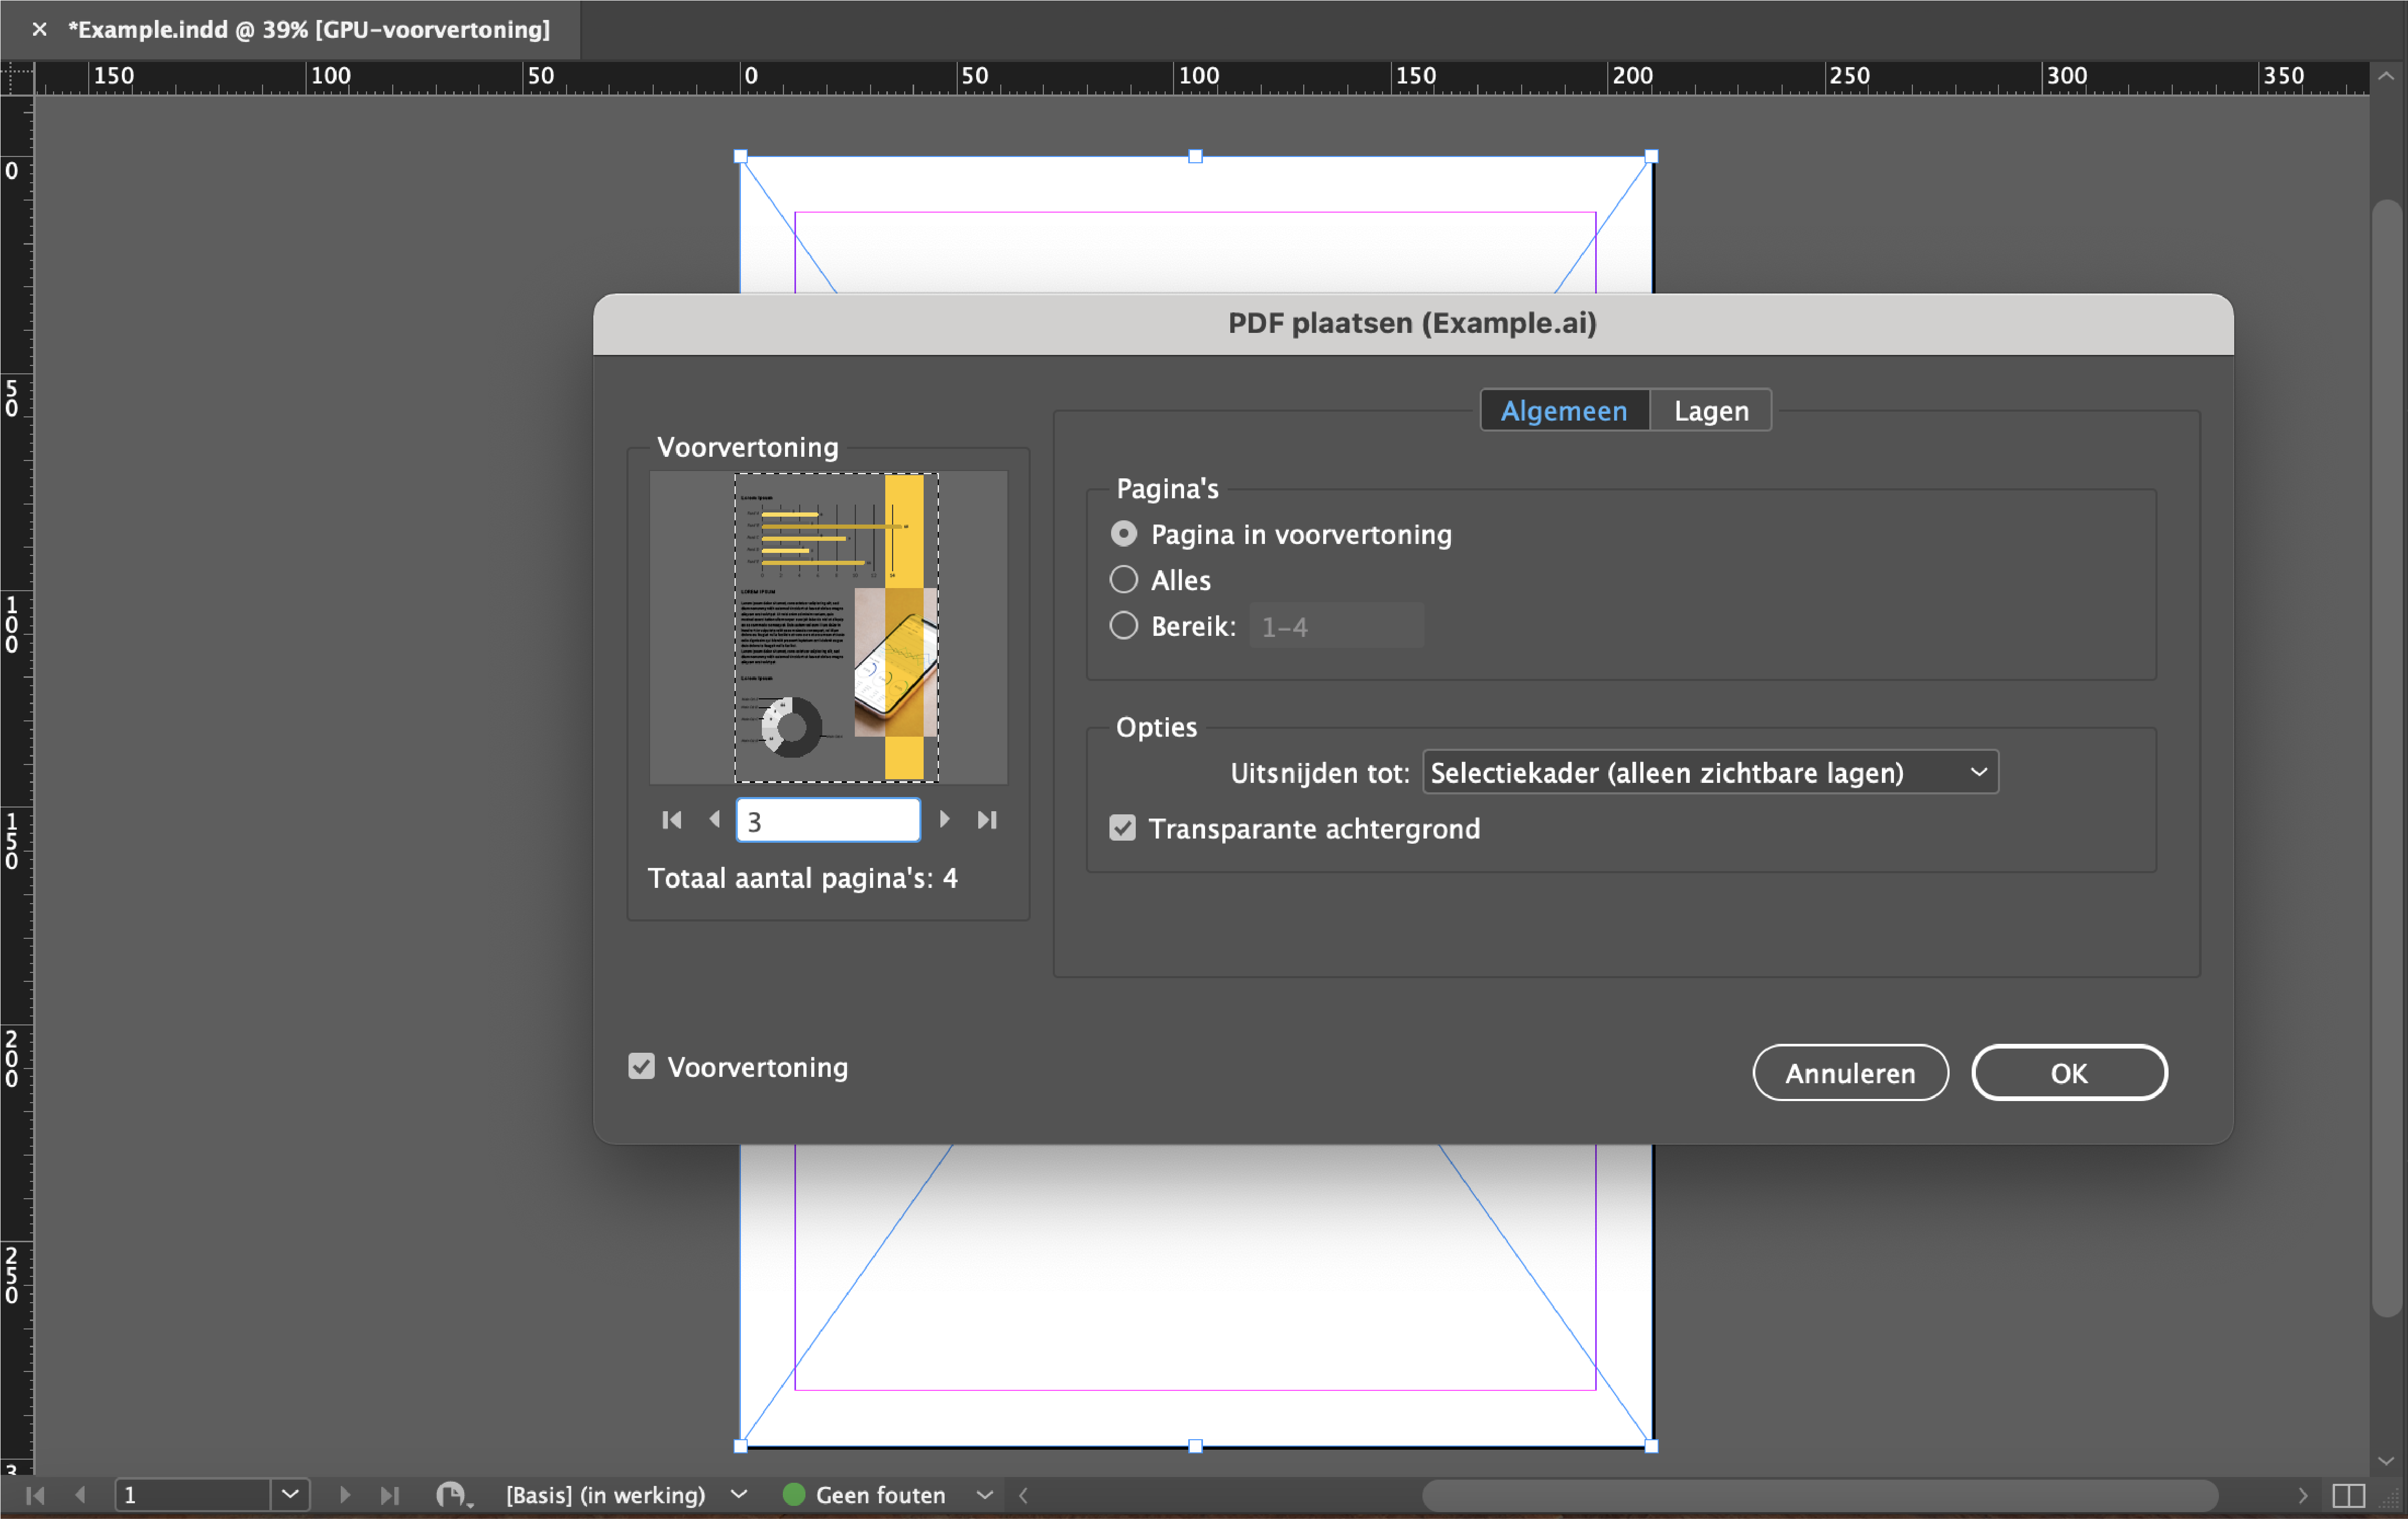
In the case of multiple artboards, click on Show import options and select the wanted artboard. See this article in the Adobe help center for more details: How to place, import, and insert images into InDesign.
-
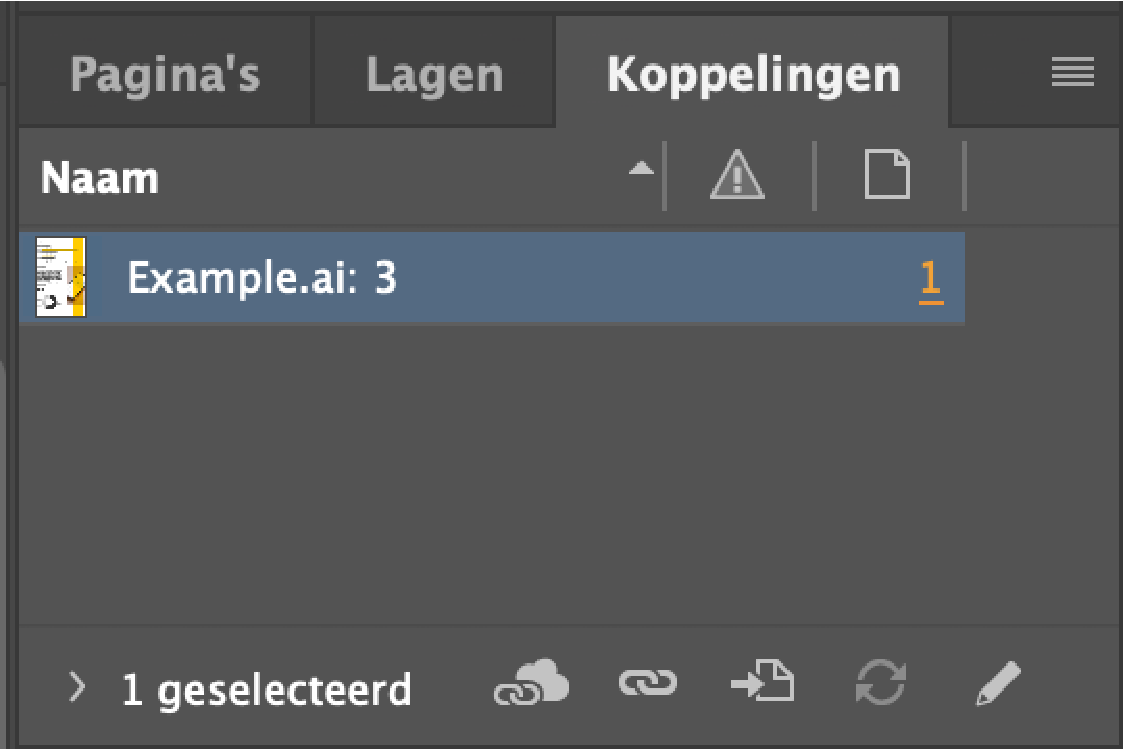
The names of artboards you’ve placed appear in the Links panel. Make sure to keep the link and do not embed the charts. See more about that here: Manage linked or embedded graphics in Adobe InDesign.
-
-
Update the charts with new data if needed.
-
Open the Illustrator file with the Datylon charts.
-
In the Datylon editor go to Manage Data > Add > Swap workbook or any other way to update your chart(s). Save the Illustrator file.
-
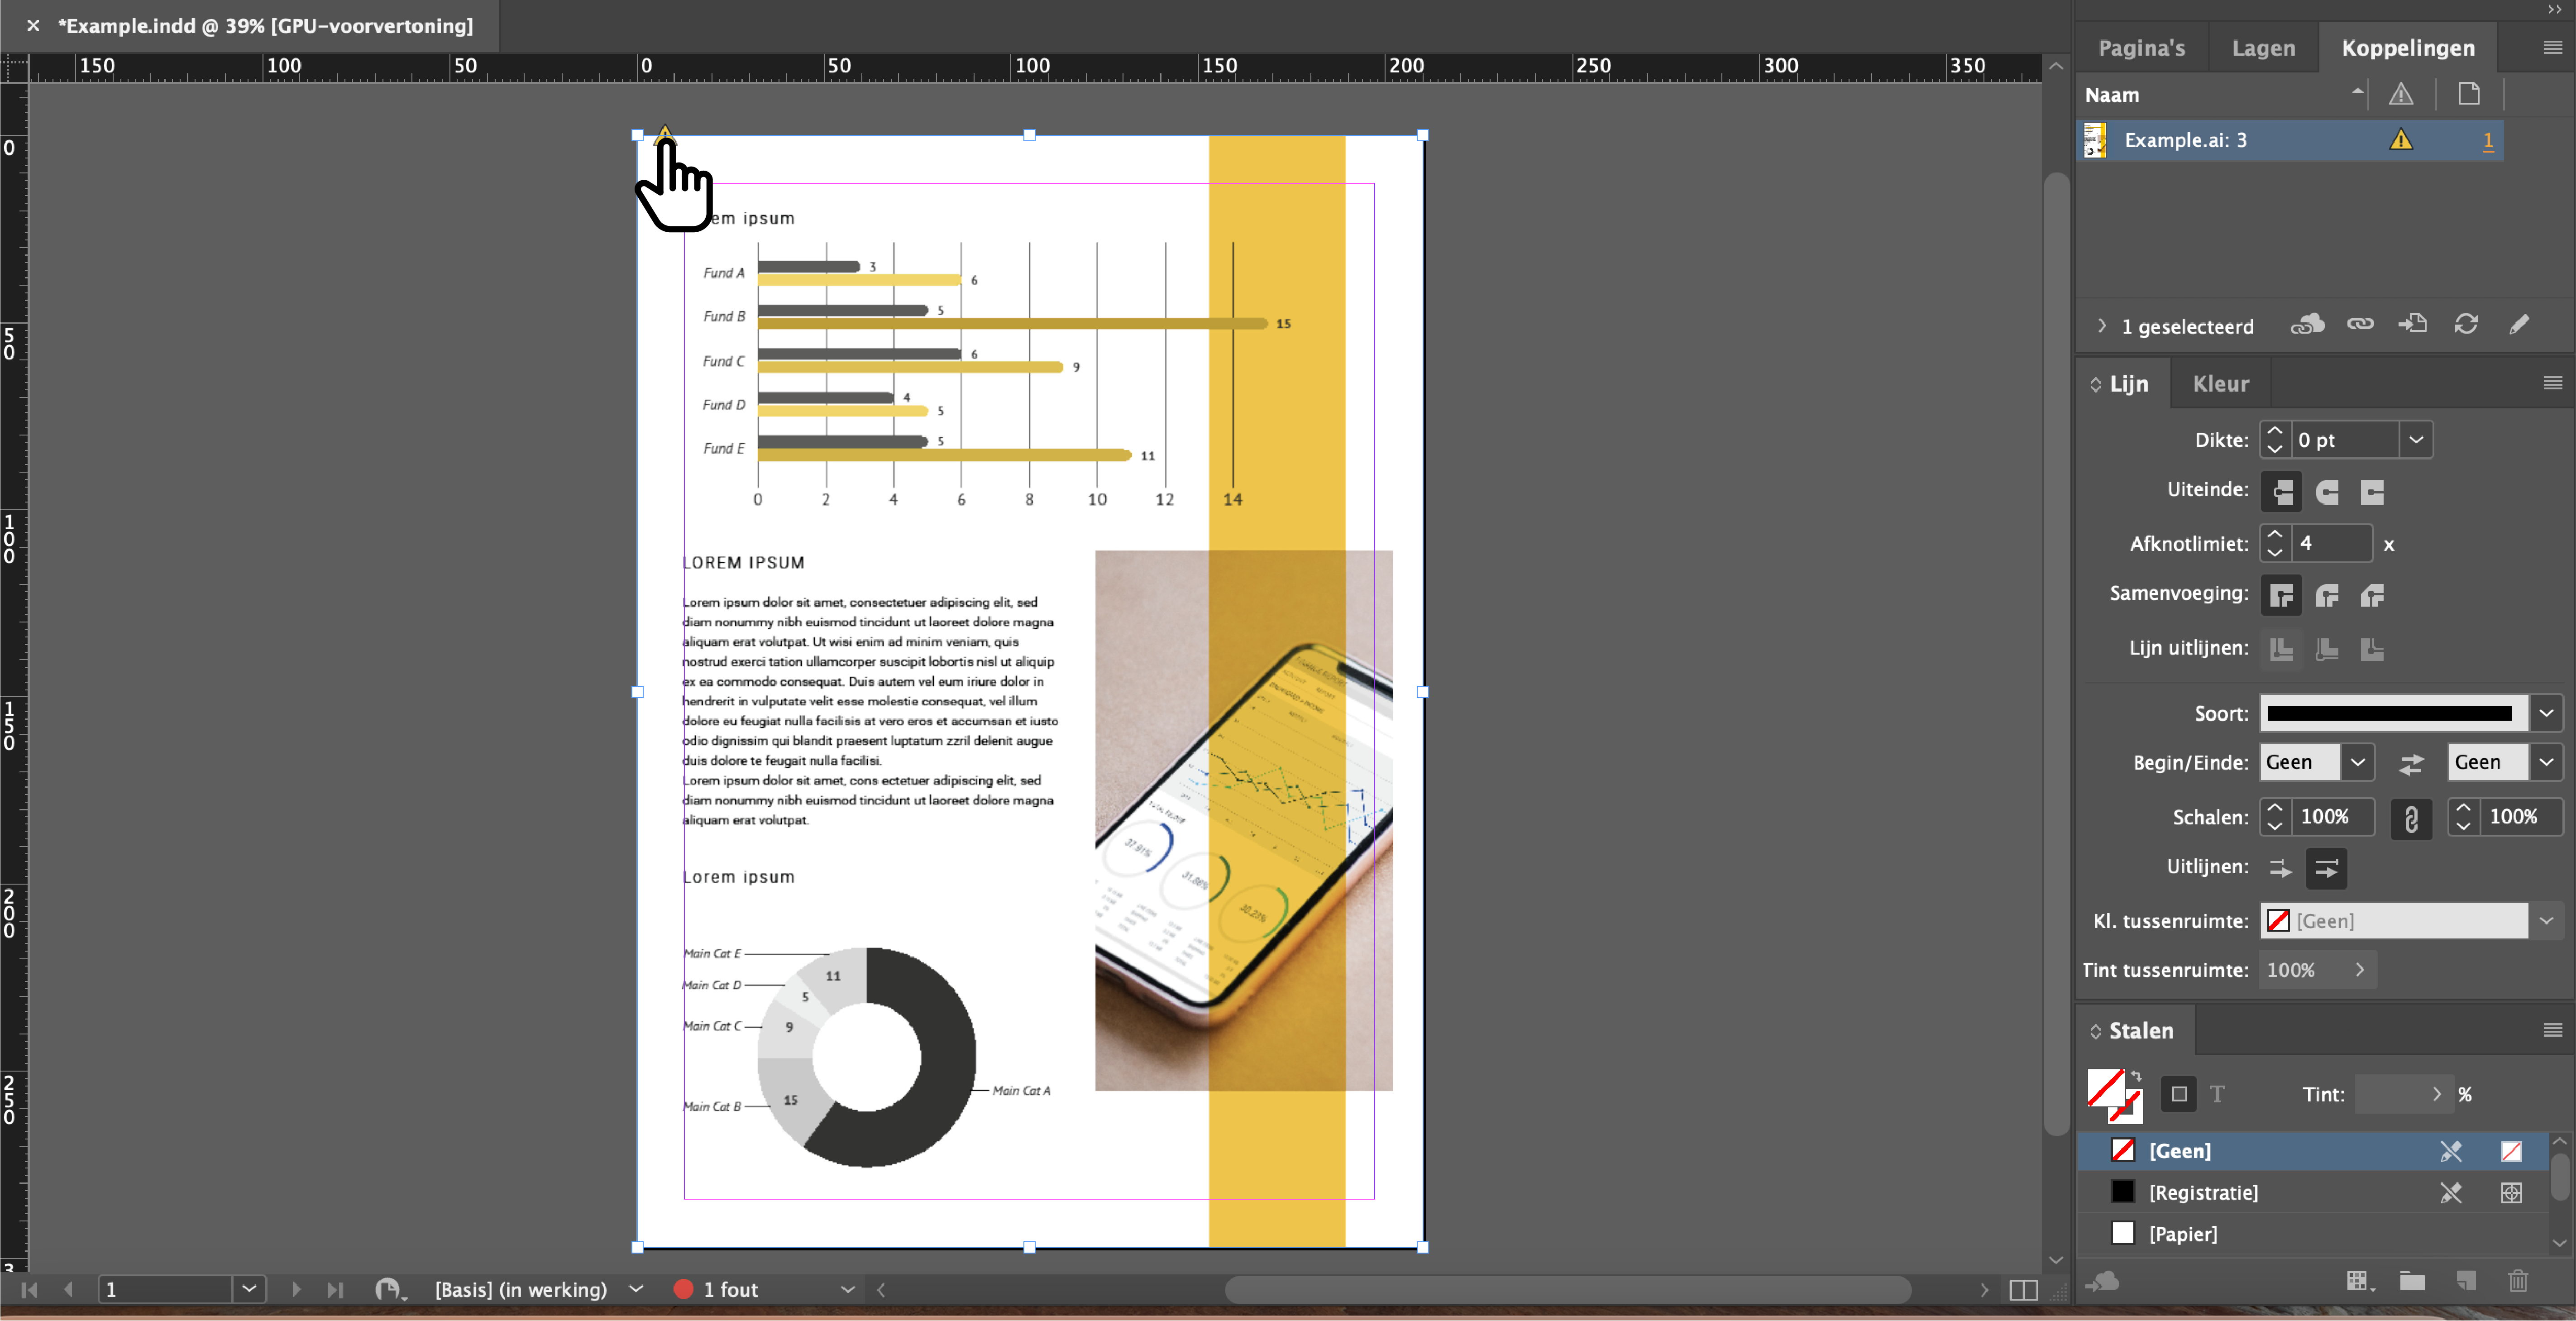
Open InDesign. If the link was kept and not embedded, a yellow triangle with an exclamation mark will appear in the Links panel and on the page itself. By clicking on this symbol, the Datylon charts will be updated with new data in the InDesign file.
-