The Datylon Report Studio and Datylon for Illustrator share the same user interface. For more info on how to open the Datylon panel in Datylon for Illustrator, see below.
The Datylon panel
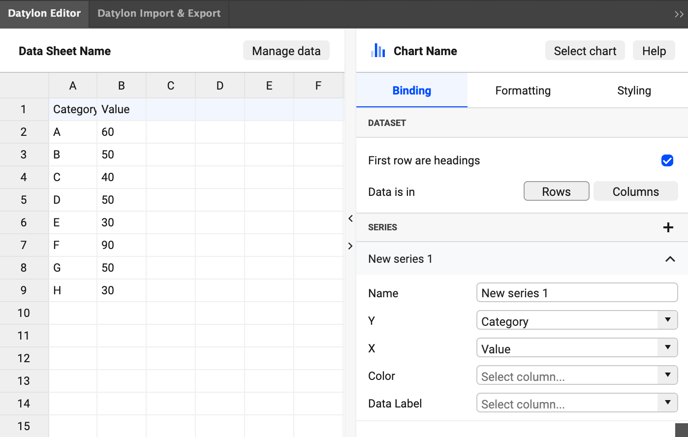
- On the left, the data pane with the Manage data button and the Data sheet name field where you can change the name of the datasheet
- On the right, the Chart Property pane with the Select Chart button and the Chart Name field where you can change the name of the Datylon chart element*.
Either pane can be closed and opened by clicking the small arrows on the bar in between the 2 panes.
Property Pane
In the property pane you'll find and 3 tabs:
Bindings tab
Mainly to bind rows and columns in the data to the data-driven properties. See also this article about binding. It is important the data is structured as a pivot table for the selected chart. Charts will not be rendered and error messages will appear if the data does not match the chart type.
Formatting tab
Formatting allows you to format the input data column per column or row per row so the data is suited to be visualized. Select a column/row from the upper list and pick one of the 3 choices: Text, Number or Date & Time.
See more in the following article: Incoming data formatting in Datylon.
Styles tab
Contains a whole series of properties to style the appearance of your chart. The properties are grouped into sections for ease of use. The sections and the properties underneath depend on the selected chart type.
*Naming datasheets and chart elements
Datylon charts and datasheet names can only be changed in the Datylon panel.
Chart names can contain any character and space. Data sheet names cannot contain special characters like ?/*[]: or \
3 places to find Datylon for Illustrator features
Datylon icon
- Can be found in the basic toolbar on the left. If not visible, add it to the basic toolbar by clicking the 3 dots underneath the basic toolbar. This will open a list with all available tools. See more details on getting started here.
- One-click on the Datylon icon allows you to drag a chart area box on the artboard. After dragging the chart area box, the Datylon for Illustrator panel opens.
- Or double-clicking the Datylon Icon opens the Datylon for Illustrator panel. Select a Datylon chart to view its data and properties.
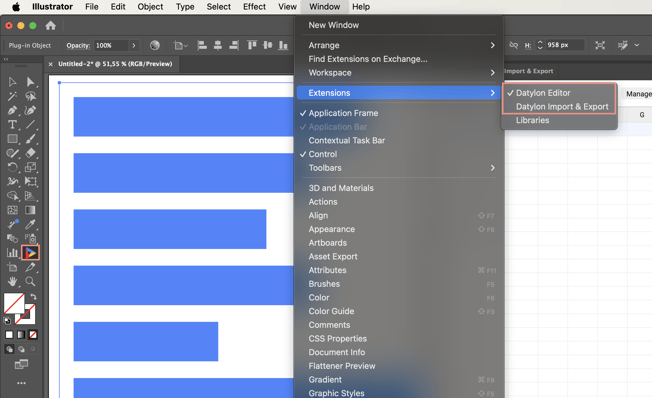
Window > Extensions > Datylon Editor
- Opens the Datylon for Illustrator panel
Window > Extensions > Datylon Account
- To log in and export your work to the Datylon Report Studio.