How to format date and time labels in charts
Learn how to format date and time labels and axes for Datylon Line, Area, and Scatter charts
This article covers date & time formatting settings only. For Text and Number settings please refer to the following article.
Date & time formatting is only supported for Bar, Line, Area and Scatter charts.
There are two steps in formatting: to define the format of the input data, and to define the format of labels. Follow the steps below to visualize date & time labels and axes correctly:
- Formatting input data in the Formatting tab
- Formatting the visualization in the Styles tab
1. Formatting input data
To ensure correct date & time labels and axes, the input data has to be formatted correctly first.
The result of data update using swap workbook might differ from direct copy/paste, as the data updated using swap workbook can contain the local format setting. To make the result consistent between different import options use the same forced formatting.
Standard strings
The following standard strings are supported by default, meaning no specific formatting in the Formatting tab is required. So formatting can be kept as None to visualize them correctly as a Date & Time label when below strings are used.
- US short time format strings, separated by a dash (-), or a slash (/):
- 2019
- 2019-09
- 2019-09-30
- 2019-09-30T14:30:00
- US long time format as in
- time formats with or without time and year
- Unix Time Stamp
- A number counting the seconds as of January 1st, 1970 at UTC
Formatting tab
In all other cases, the input data shall first be formatted in the Formatting tab.
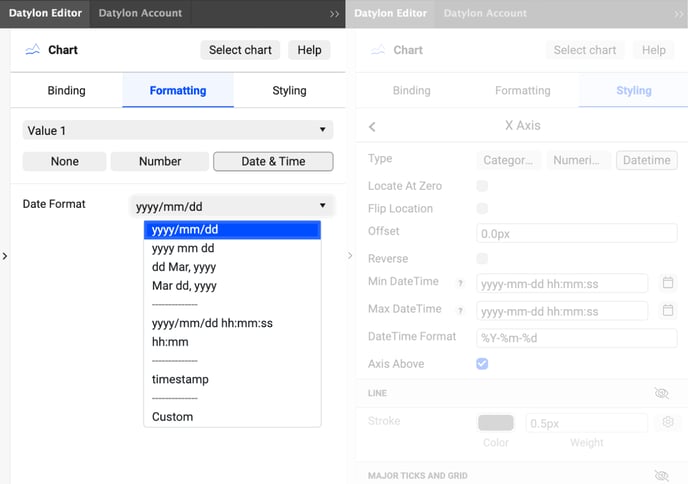
The data in the datasheets can have many different formats regarding date & time. Sometimes as year only, up to full year/month/day with hours, minutes and seconds.
In the Formatting tab, you can specify the format of the incoming data after selecting the relevant column or row and clicking the Date & Time button.
In the Date Format list, you have several default options next to Custom, which allows you to define a custom date & time format string by using any of the specifiers below:
-
- %a - abbreviated weekday name.*
- %A - full weekday name.*
- %b - abbreviated month name.*
- %B - full month name.*
- %c - the locale’s date and time, such as %x, %X.*
- %d - zero-padded day of the month as a decimal number [01,31].
- %e - space-padded day of the month as a decimal number [ 1,31]; equivalent to %_d.
- %f - microseconds as a decimal number [000000, 999999].
- %H - hour (24-hour clock) as a decimal number [00,23].
- %I - hour (12-hour clock) as a decimal number [01,12].
- %j - day of the year as a decimal number [001,366].
- %L - milliseconds as a decimal number [000, 999].
- %m - month as a decimal number [01,12].
- %M - minute as a decimal number [00,59].
-
- %p - either AM or PM.*
- %q - quarter as a decimal number [1,4]
-
- %Q - milliseconds since UNIX epoch.
- %s - seconds since UNIX epoch.
- %S - second as a decimal number [00,61].
- %u - Monday-based (ISO 8601) weekday as a decimal number [1,7].
- %U - Sunday-based week of the year as a decimal number [00,53].
- %V - ISO 8601 week of the year as a decimal number [01, 53].
- %w - Sunday-based weekday as a decimal number [0,6].
- %W - Monday-based week of the year as a decimal number [00,53].
- %x - the locale’s date, such as %-m/%-d/%Y.*
- %X - the locale’s time, such as %-I:%M:%S %p.*
- %y - year without century as a decimal number [00,99].
- %Y - year with century as a decimal number.
- %Z - time zone offset, such as -0700, -07:00, -07, or Z.
- %% - a literal percent sign (%).
Directives marked with an asterisk (*) may be affected by the locale definition.
For example:
%Y refers to the year, %m the month and %d the day in numbers. These specifiers can be combined with other characters: e.g. "2022-07-04", as in the 4th of July 2022, should be defined as %Y-%m-%d.
2. Formatting the visualization
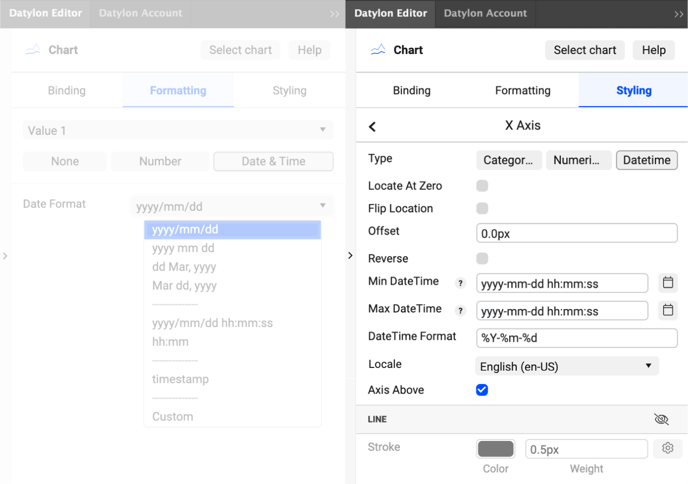
If the standard strings are used, or once the format of the input data is set correctly, check the DateTime button in Styles > X or Y-axis.
In the DateTime Format field you can then define how the axis labels are visualized by using the same specifiers as above.
The Locale option allows you to select one of 31 languages for the full and abbreviated month and weekday names.
Example 1
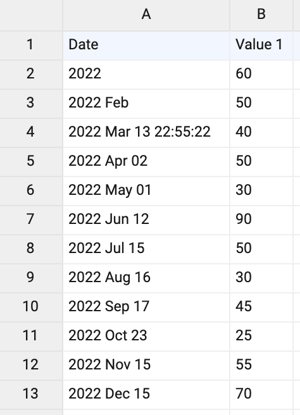
There is a dataset with various formats in "Date" column. In the given case all the formats are automatically recognized by Datylon so there is no need to change anything in the Formatting tab. Each value will be transformed into a unified format:
"2022" will be interpreted as "2022-01-01 00:00:00".
"2022 Feb" will be interpreted as "2022-02-01 00:00:00".
"2022 Apr 02" will be interpreted as "2022-04-02 00:00:00" etc.
If a month or date is missing it will be recorded as "01".
If hours, minutes or seconds are missing it will be recorded as "00".
If a year is missing it will be recorded as "2001".
The next step is to set the X-Axis. Currently it is set to "Categorical" type.
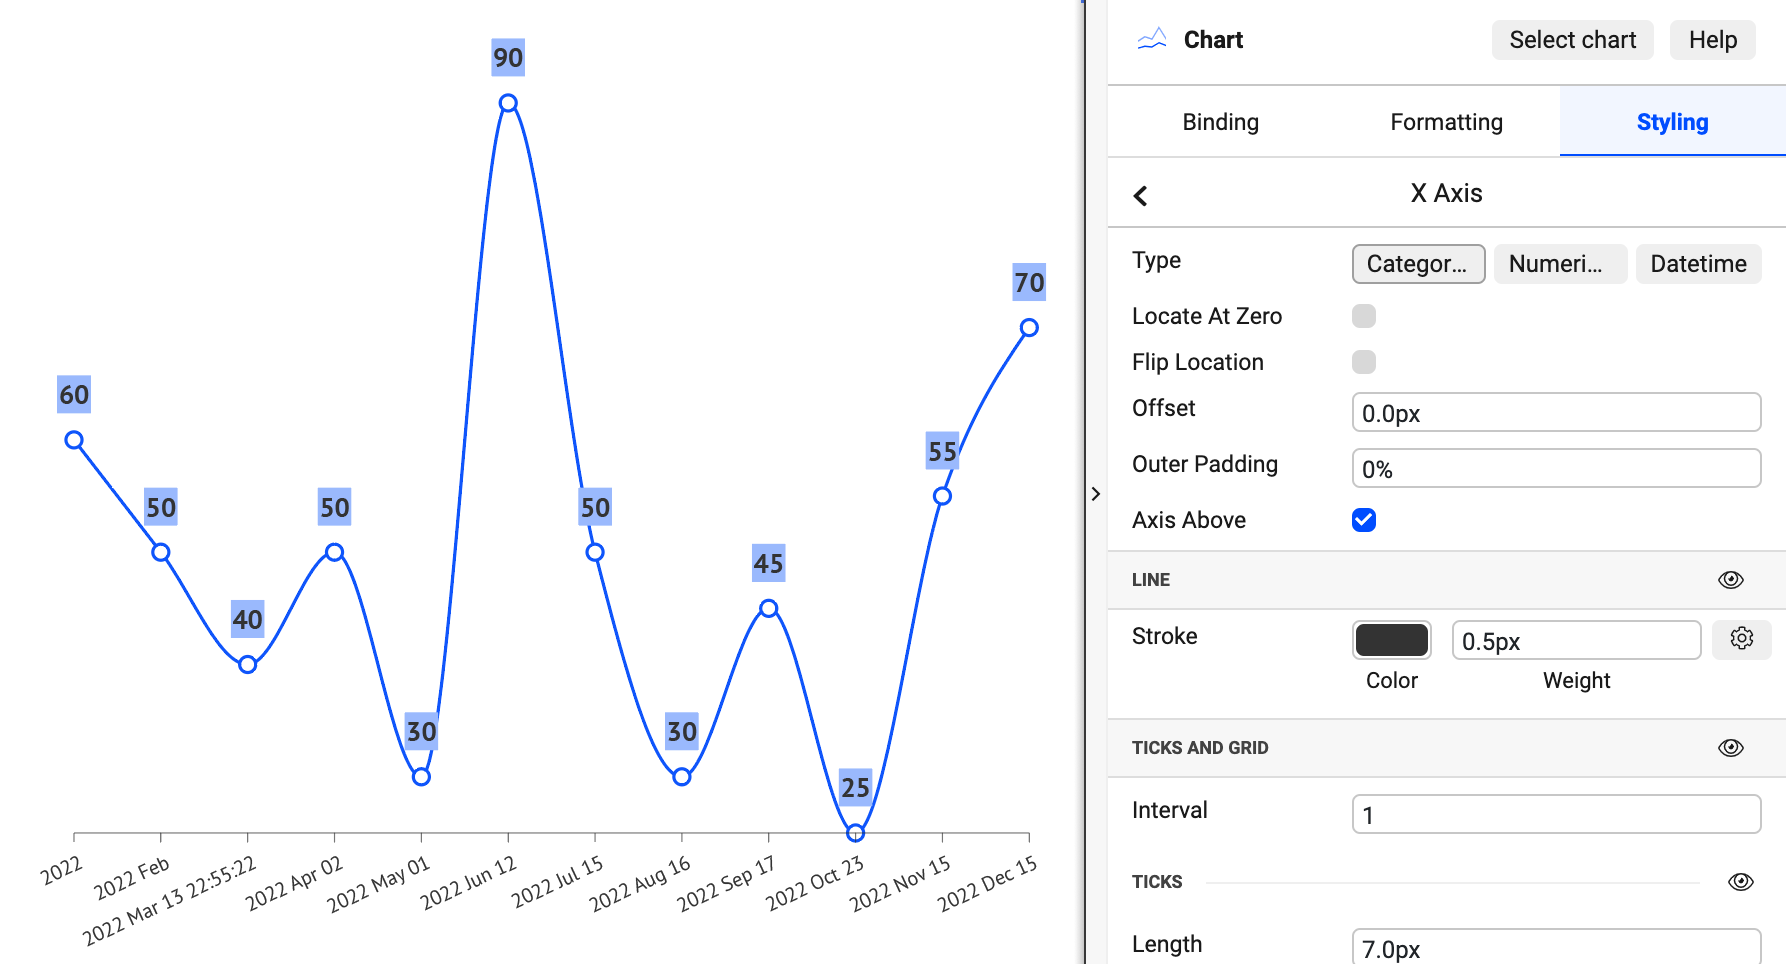
This means that all the data from Date column will be perceived as text. To change that select the Datetime type.
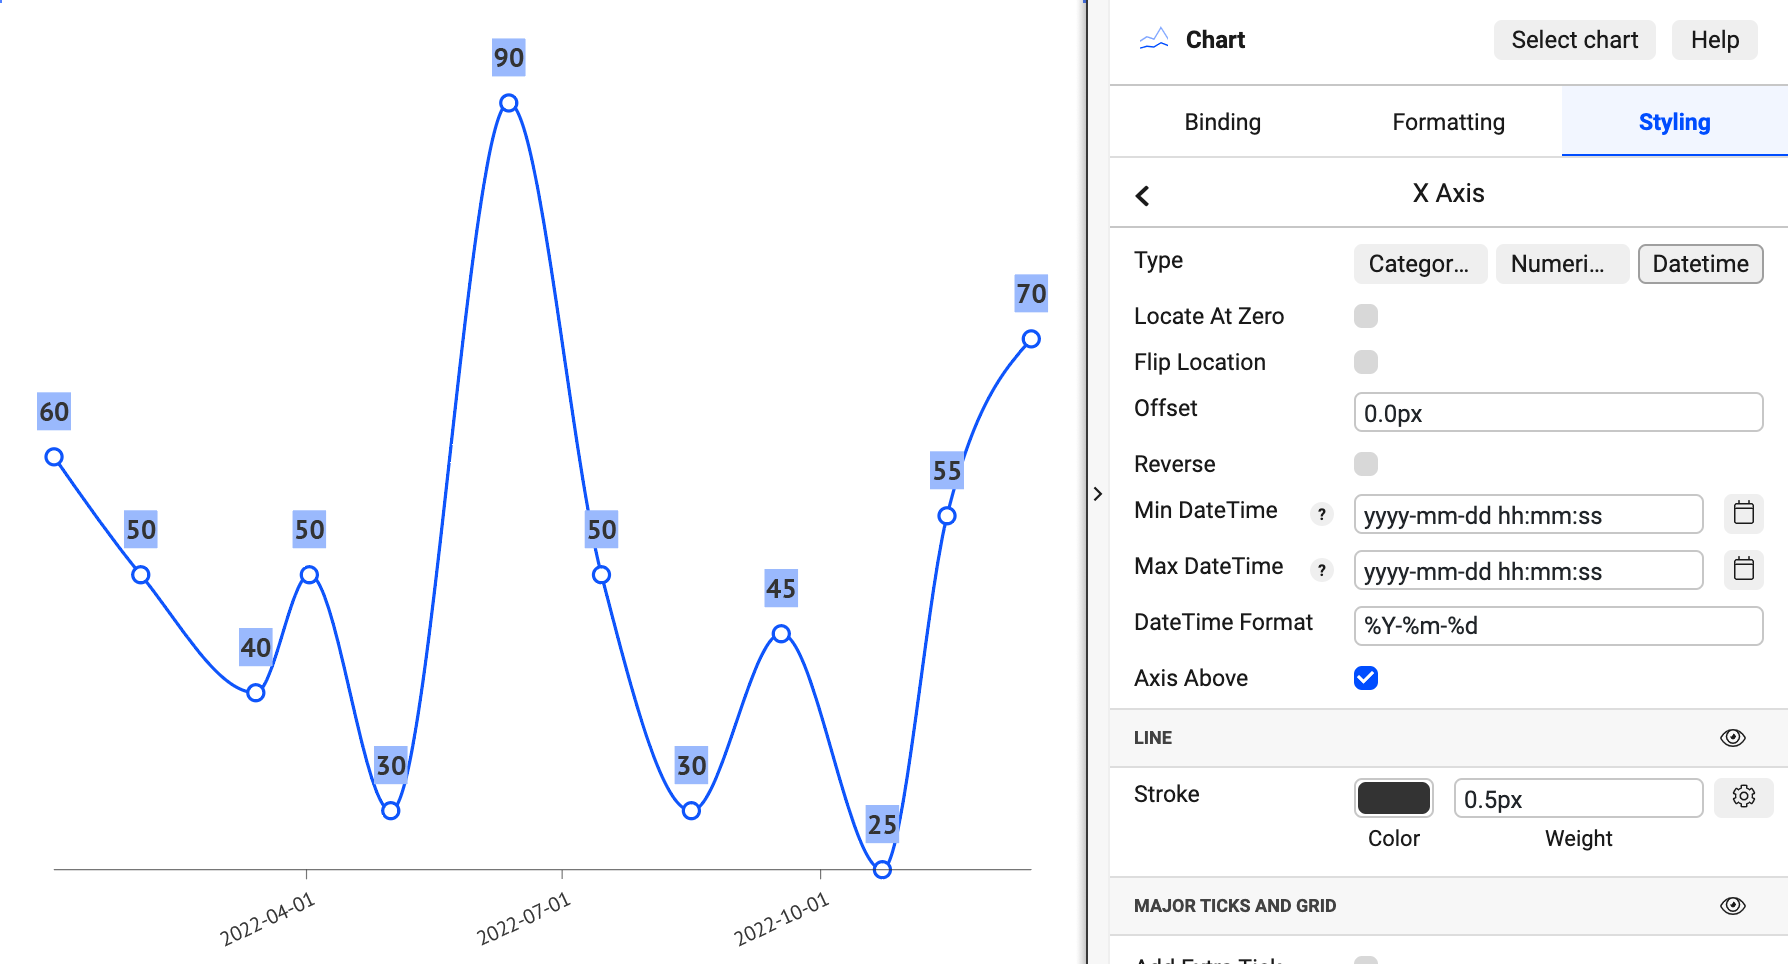
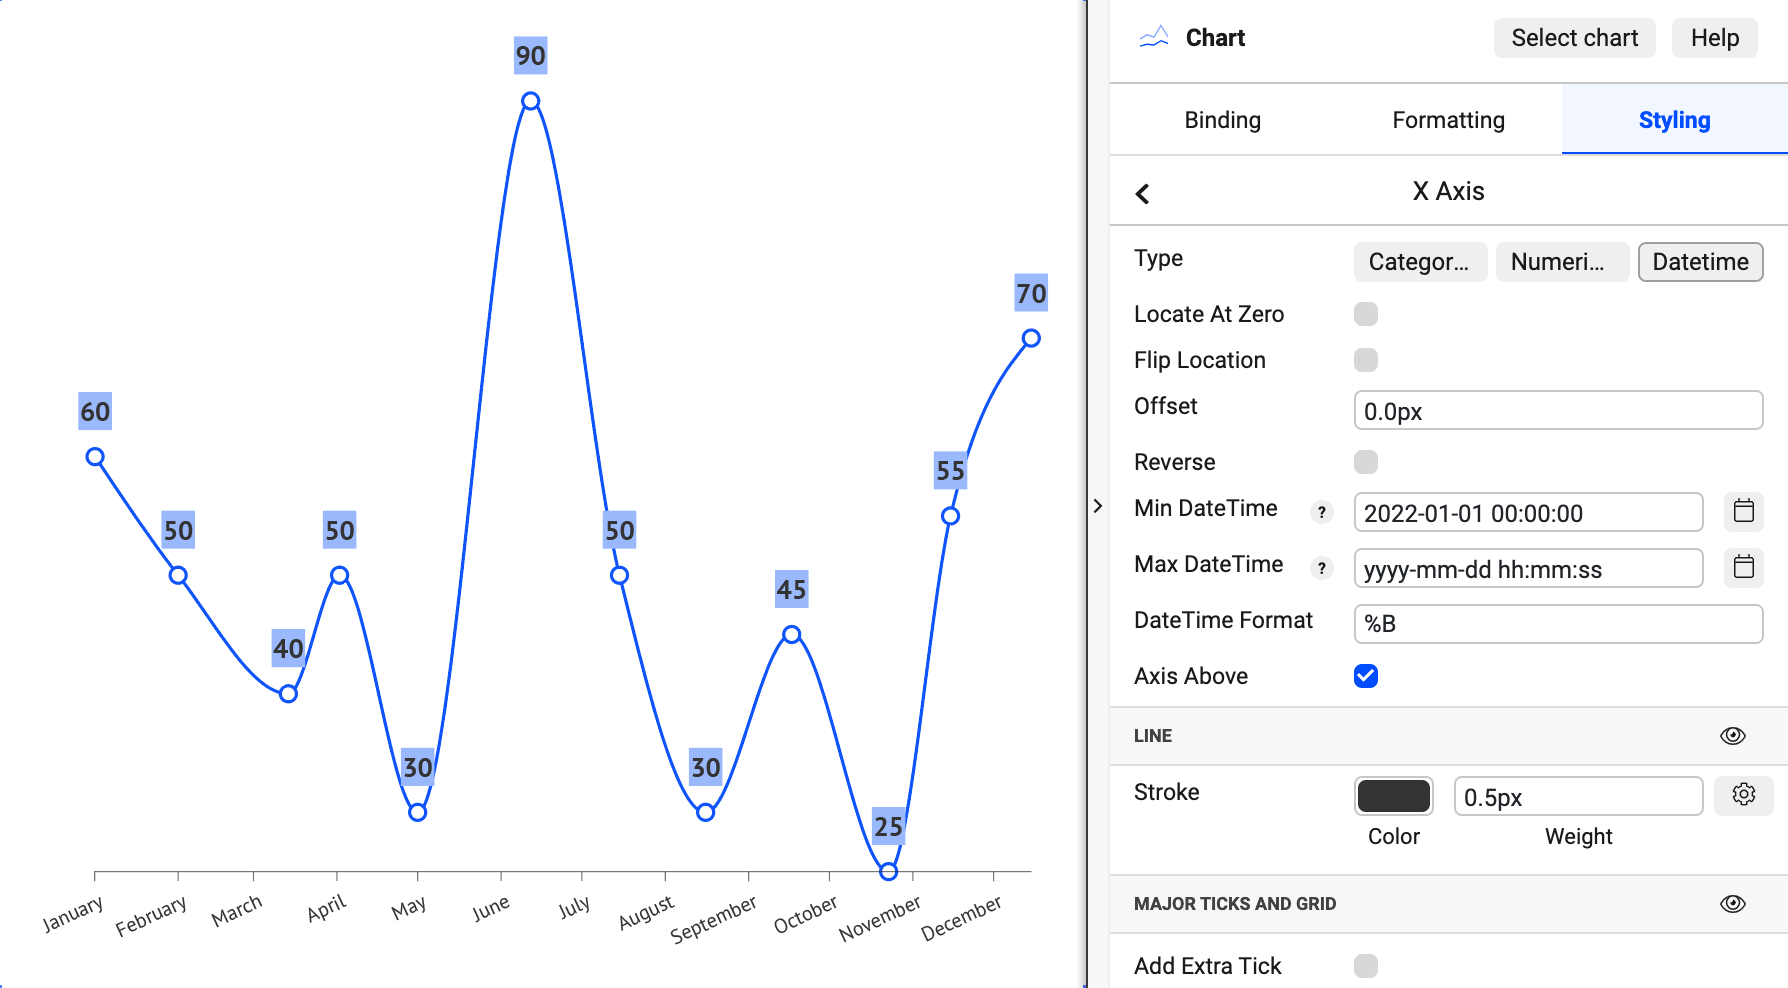
Now data points are dispersed according to data. If we want to place ticks at the start of every month we should set Min Date to "2022-01-01 00:00:00", turn on Major ticks and grid and Custom ticks amount, set Ticks Interval to "1 month" and set Starting Tick to "2022-01-01 00:00:00". To apply full name of the month for X-Axis labels set Time Format to "%B" (the list of available options can be seen above in the current article).
Example 2
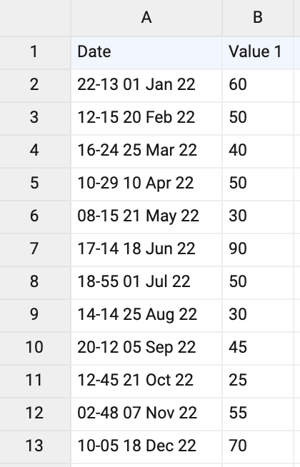
If we use a dataset with date & time values that couldn't be recognized automatically by Datylon, changes have to be made in the Formatting:
Formatting > Date (column with date & time values) > Date & Time > Date Format > Custom > %H - %M %d %b %y (for the current example)
After that data would be in a format that is recognisable by Datylon. One can proceed to styling as shown above.