Introduction
Datylon comes with a very powerful feature to define colors and some other properties using reference codes in the data. Linking the reference codes to chart elements is done in the Bindings tab.
If colors or other properties are bound, they overrule any other similar setting in the Styling tab.
The following properties can be bound:
|
Chart Type |
Features |
|
Area chart |
Data label |
|
Bar chart |
Bar color, Data label |
|
Scatter plot |
Data Mark color, Data Mark stroke color, Icon type, Data label |
|
Pie chart |
Slice color, Slice Stroke color, Slice radius, |
| Dot plot |
Icon color, Icon type |
|
Heat map |
Cell color, Data label |
|
Icon array |
Icon color, Icon type |
|
Icon chart |
Icon size, Icon color, Icon type, Data Label |
|
Line chart |
Data label |
|
Bullet chart |
Bar color, Custom range labels |
|
Text Object |
Tag Name & Value |
|
Tree map |
Cell size, Cell color, Data label |
Binding Colors
To bind colors, follow the steps below. In the example, the data is structured in rows.
- Add a column to your data with one of the following color descriptions:
- In RGB color mode there are 4 formats to define a color in data:
- #RRGGBB : hexadecimal format. Fully opaque, or 0% transparency.
- #RRGGBBAA : in a hexadecimal format where AA defines the opacity from 00 (0) to FF (255).
- HTML color names. Case insensitive. HEX codes can be mixed with HTML color names in one column.
- rgb(RRR,GGG,BBB) : Red, green and blue values from 0 to 255. Fully opaque, or 0% transparency.
- rgba(RRR,GGG,BBB,AAA) : Red, Green, Blue from 0 to 255, and Opacity (AAA) from 0 to 1 e.g 0.5 for 50% opacity.
- In RGB color mode there are 4 formats to define a color in data:
-
- CMYK color mode (Datylon for Illustrator only), has 2 supported formats:
- CCC,MMM,YYY,KKK : whole numbers between 0-100 separated by comma’s e.g. 0,37,100,0. Fully opaque, or 0% transparency.
- CCC,MMM,YYY,KKK, AAA : where AAA adds the opacity from 0 (transparent) to 100 (fully opaque).
- If an invalid color code or name is entered, the result will be black without a warning or notification.
- Empty fields in the bound column will keep the default color as set in Styling.
- The color codes can be typed in or pasted in straight in the data sheet. The HEX codes can be copied from the Datylon color panel.
- When using a spreadsheet, the color codes can even be generated with a formula based on the other data and imported in Datylon with the Data sheet manager. This is particularly useful for data-driven or conditional coloring of your chart.
- CMYK color mode (Datylon for Illustrator only), has 2 supported formats:
- Go to the Bindings tab and select the column from the list in the desired Color property. The chart will be re-rendered with the new colors. At any time now, data with new color information can be imported to update the color of the chart.
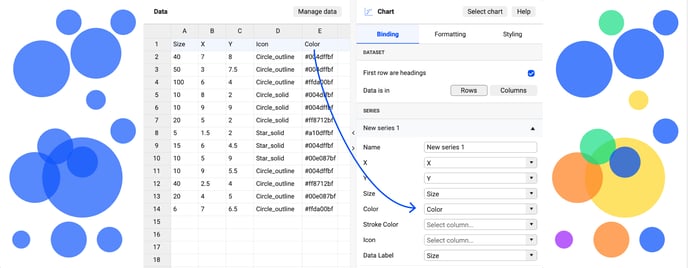
Binding Icon type for Scatter chart and Icon array
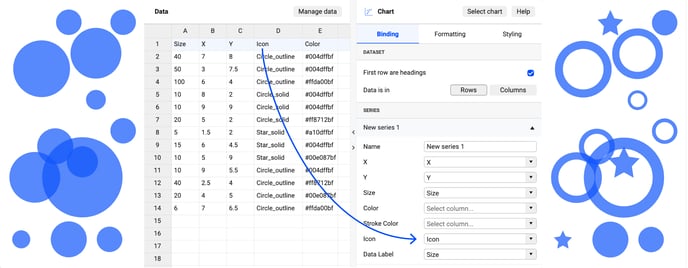
By adding icon names in the data and binding this column/row to Icon under the Binding tab, you can assign icon types to data points.
Proceed as described in color binding, but instead of color codes, add icon type names in your data before binding to Icon Type in the Binding tab.
See below the list of the icons and the names which should be used in the datasheet. The icon names are cap sensitive. ![]()
Note the names are case sensitive and do not fully correspond with the icon names in the list of the Datylon panel.
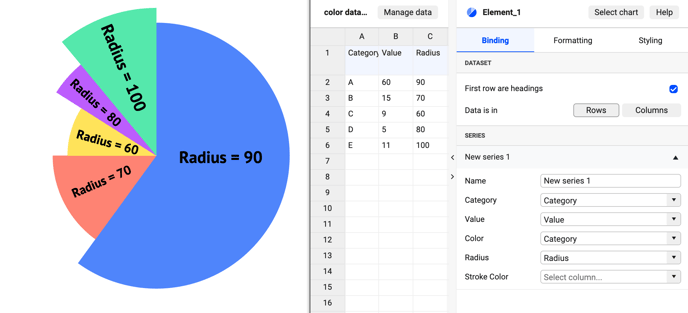
Binding Slice radius for Pie chart
- Proceed as indicated above, but instead of color codes or icon types, add the radius value in your data before binding to Radius in the Binding tab.
- The radius is expressed in percentages of the maximum radius of the pie and can be any number between 0 and 100.
- When a field is left empty it is considered as 100%.
- Do not add the %.