Text object properties
Below you can find in-depth user information about each property, what it does and how it can be applied
Binding Tab
1 Dataset
2 Series
Styling Tab
GENERAL
1 Position and Size
1.2 Margins (Fixed Position Margins only)
2 Appearance
DATA
3 Text
Text decoration options
Options
Text placeholders
Options
Binding Tab
Dataset>
| First row/column are headings |
When enabled, the first row (column) of the dataset are headings. When disabled, the first row (column) of the dataset is included in the data range. |

|
| Data is in | Sets the way data is structured: in rows or columns. | 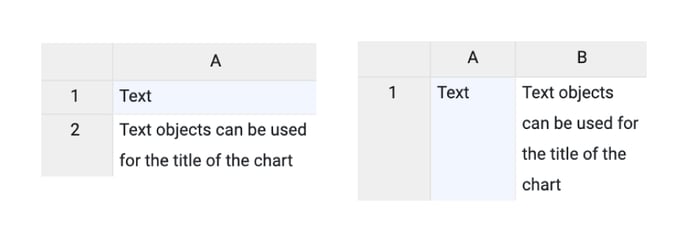 |
Series>
| Name | Text field to name the Series. By default, it is set to “New Series n”. In the Text Object, only one series is available. | 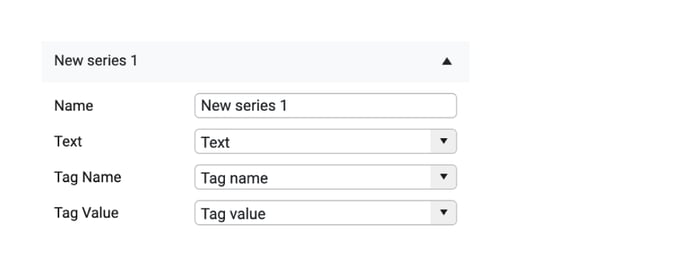 |
| Text | Sets the text that will be placed. Every cell in the given row/column represents a new paragraph. | 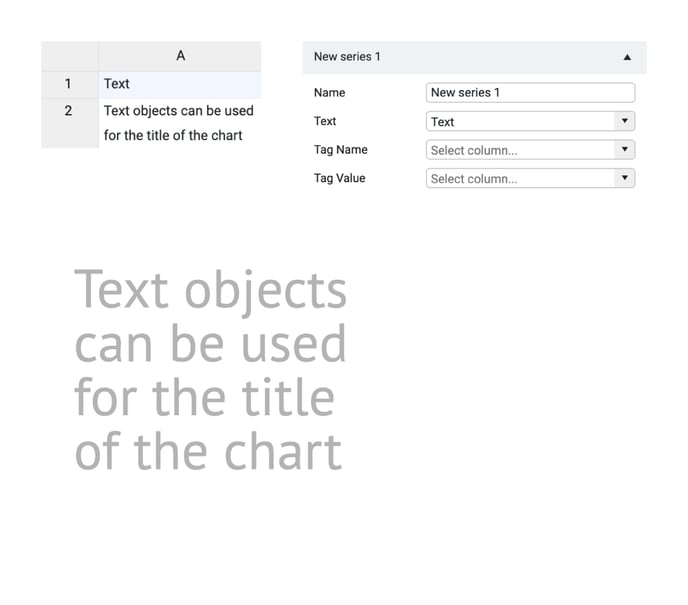 |
| Tag Name | Sets the tag name that could be placed in the Text column/row and will be linked to replaceable text in Tag Value column/row. The syntax of the tag is the following: {{tag:tagName}} |
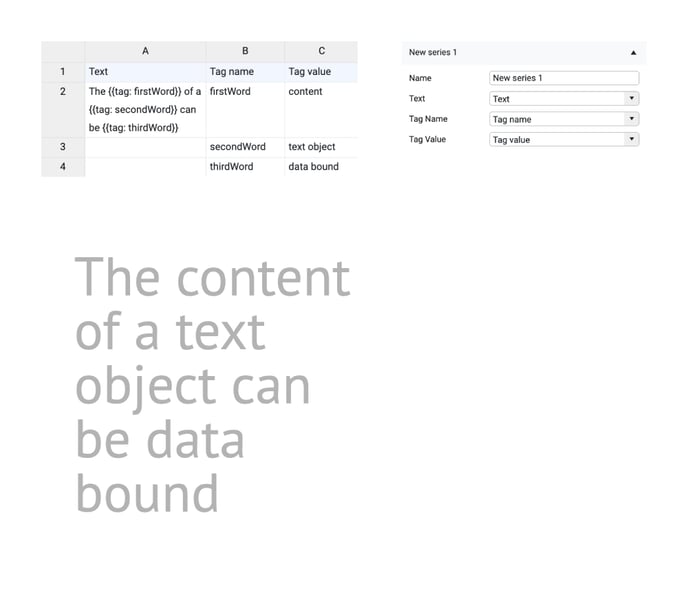 |
| Tag Value | Sets the value that is linked to the tag and will be placed into the text instead of the tag placeholder. |
Styling Tab
GENERAL
Appearance>
| Chart Rotation | Rotates the whole chart area preserving the width and height ratio. |  |
DATA
Text>
| Horizontal Align | Aligns the text left, centered, or right. | 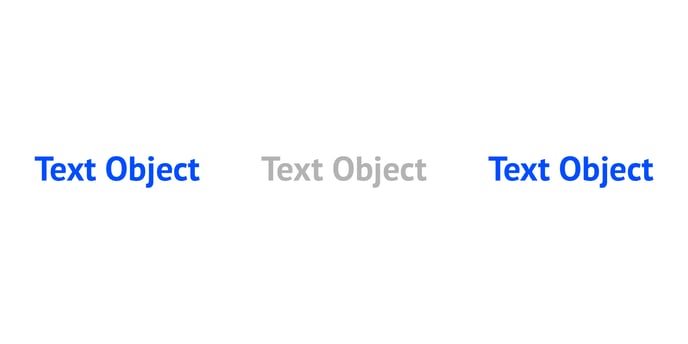 |
| Justify |
Justify all lines excluding the last line. |
 |
| Vertical Align | Aligns the text with the top, center or bottom. | 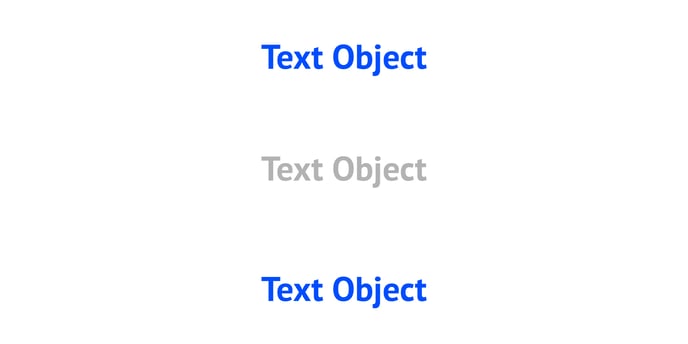 |
| Right Wrap | Wrap the text in the plot area. |  |
| Paragraph Spacing | Sets space between paragraphs. A paragraph is a text inside one cell. | 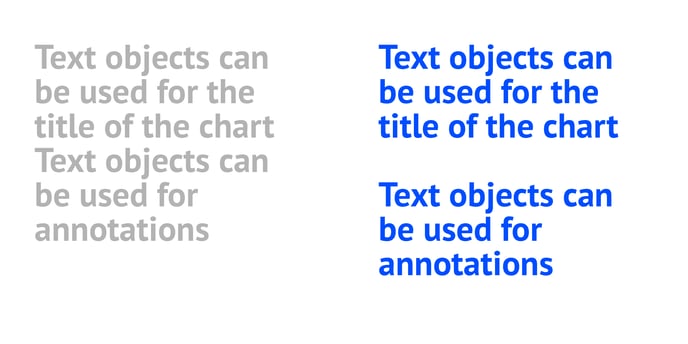 |
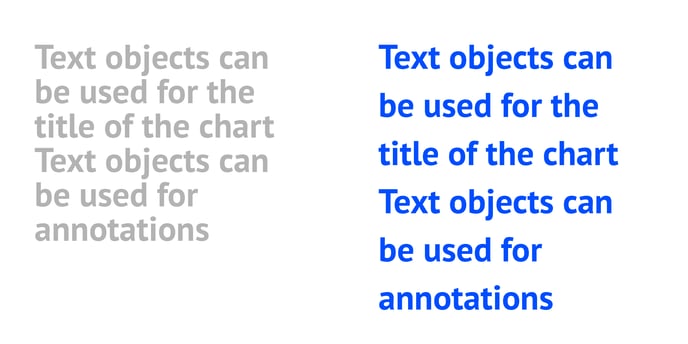
| Leading |
Sets the spacing between adjacent lines of text. "0" will make the lines fall on top of each other. "1" is the default leading. |
 |
| Tracking |
Sets the amount of tracking in the text. Tracking is the spacing between characters. The value can either be positive or negative. "0" is the default tracking value. |
FONT
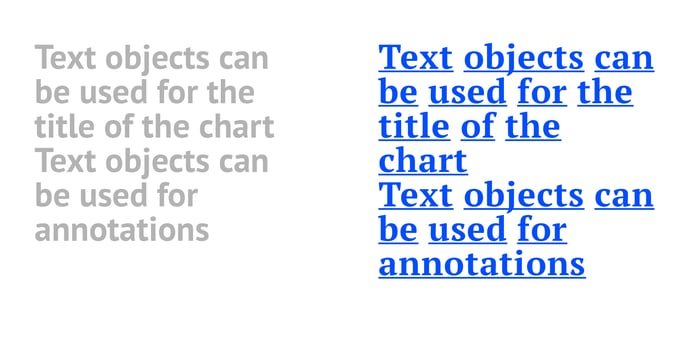
| Typeface |
Sets font style, color, and size. When clicking the cogwheel one has two text decoration options: crossed text and underlined text. See more on fonts here. |
 |
| Fit | Sets the font to the size that makes the text fit the maximum possible space inside the chart area. | 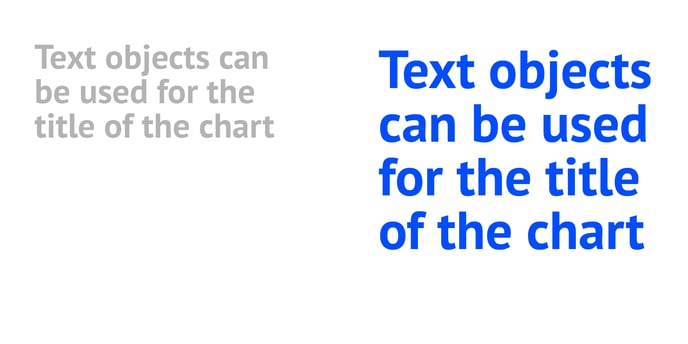 |
Text decoration options
Text decoration of characters or complete words in the data of a Text object can be applied by using specifiers before and after the word.
Only a continuous string, without spaces, can be formatted. Multiple words with spaces in between need to be formatted individually.
The specifiers need to be added before and after the word.
The different supported decoration options are:
| +Underline+ | This is a +string+ of text. | This is a string of text. |
| ^superscript^ | This is a ^string^ of text. |  |
| ~subscript~ | This is a ~string~ of text. |  |
| Color | This is {color:#abc333}string{color} of text. |  |
|
Non-breaking space |
for Windows: Alt+0160 for Mac: Option+Space |
|
|
Hard return |
\n |
|
|
Overrule styling |
\ |
Text placeholders
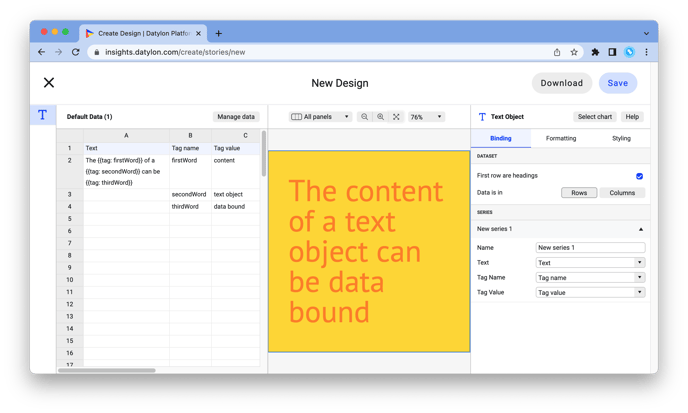
A string of text in a Text object can contain a placeholder for data.
A placeholder is delimited with double curly brackets and contains a tag name e.g.
{{tag: birthdate}}
The Tag name and Tag value (the actual text) have to be bound to the respective columns/rows under the Binding tab in the Datylon editor.
When properly bound, the below dataset will result in the following sentence in the Text object:
The content of a text object can be data bound.
| Text | Tag name | Tag value |
| The {{tag: firstWord}} of a {{tag: secondWord}} can be {{tag: thirdWord}}. | firstWord | content |
| secondWord | text object | |
| thirdWord | data bound |
The below sample can be found as one of the default Text object charts in the Datylon chart maker or Datylon for Illustrator.
