Many properties in the DATA section can be set overall for the whole chart, but also separately on the data point level. See data point styling for more details.
Binding Tab
1 Dataset
2 Series
Styling Tab
General
1 Position and Size
2 Appearance
3 Legend
Data
3. Data Marks
4. Data Labels
Analysis
5 Trendline
Axes and Grid
6 Axis > Type: Categorical Axis
7 Axis > Type: Numerical Axis
8 Axis > Type: Datetime
Binding Tab
Dataset>
| First row (column) are headings |
When enabled, the first row (column) of the dataset are headings. When disabled, the first row (column) of the dataset is included in the data range. |
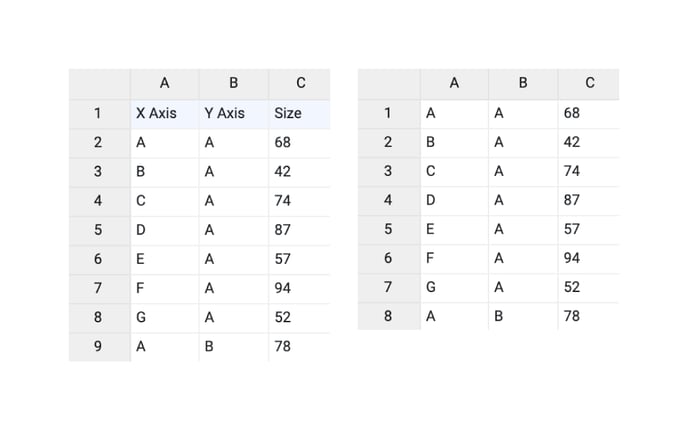 |
| Data is in | Sets the way data is structured: in rows or columns. | 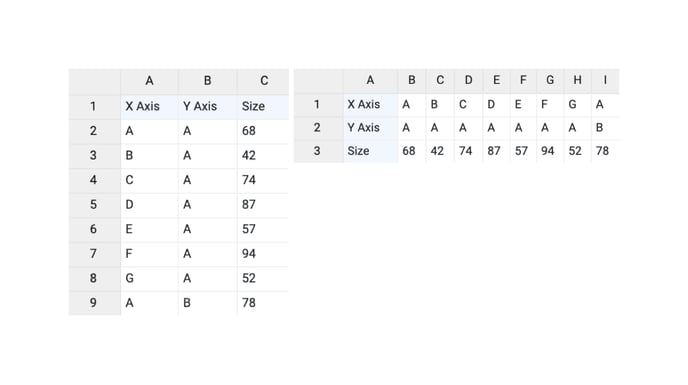 |
Series>
| Name | Text field to name the Series. By default, it is set to “New Series n”. In the Scatter Plot, only one series is available. | 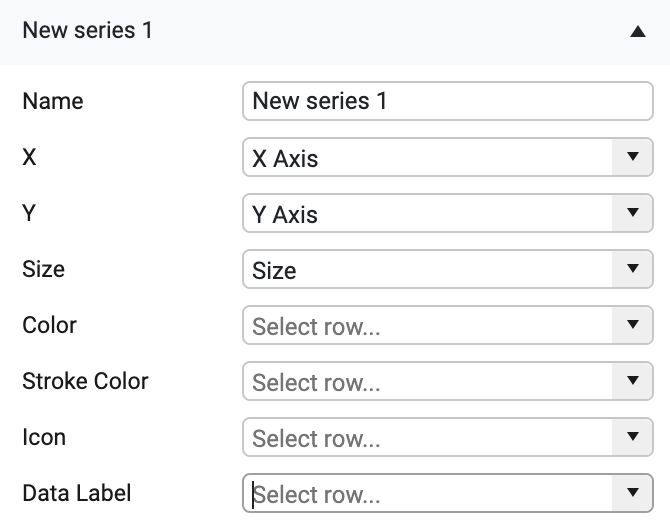 |
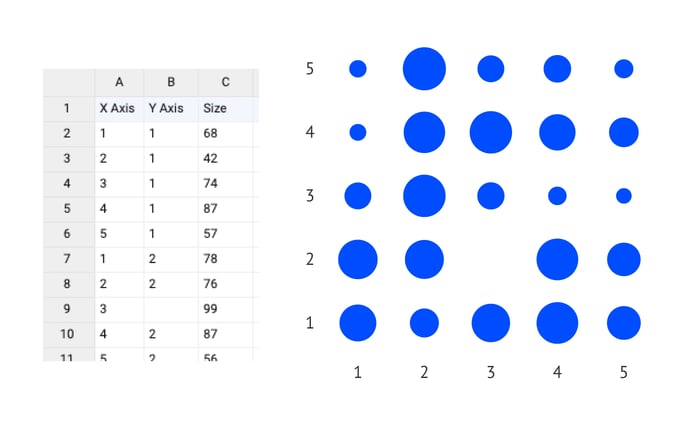
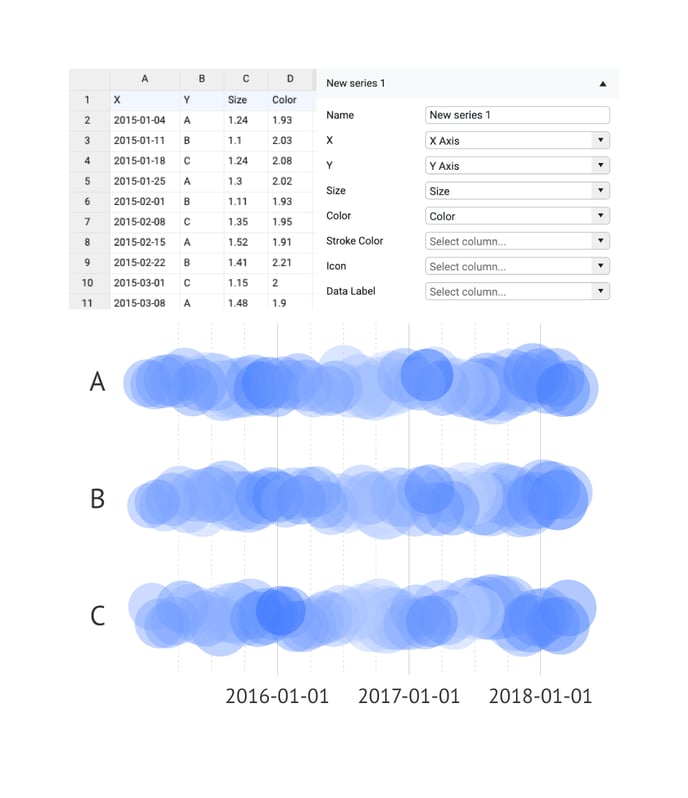
| X, Y | Used to bind the data to the X, Y position of the data mark. The bound column/row can represent categorical, numerical, or datetime values. | 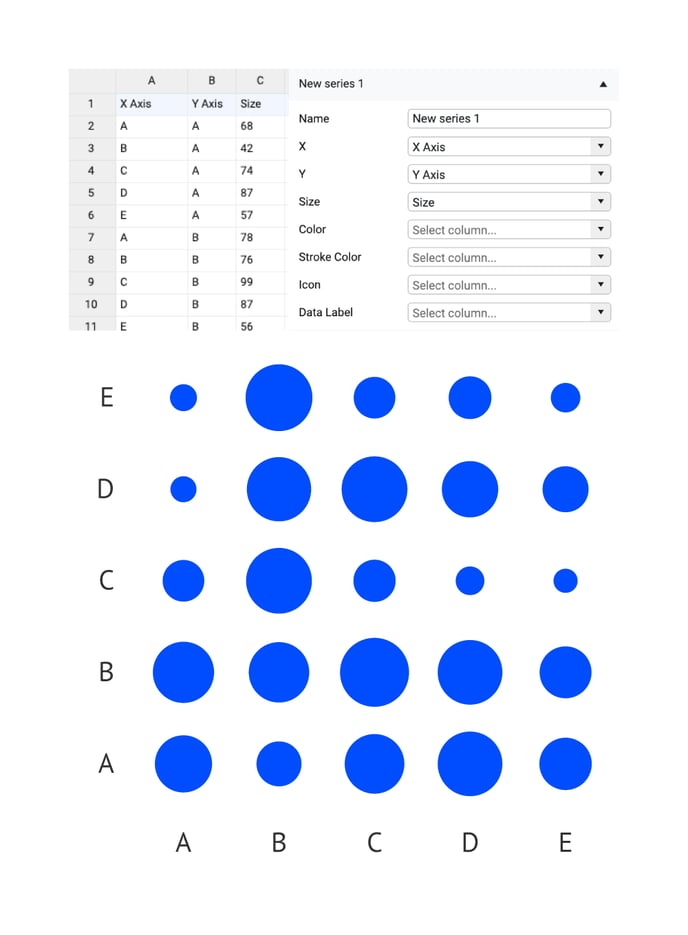 |
|
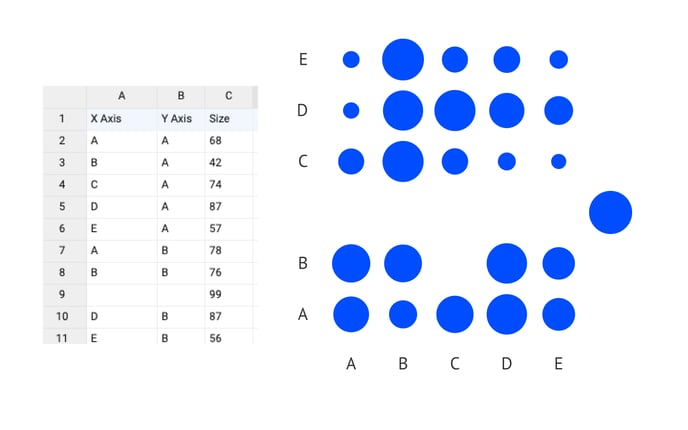
One or more empty cells will give the following result:
“Empty values found where datetime values were expected. Data is ignored” |
|
|
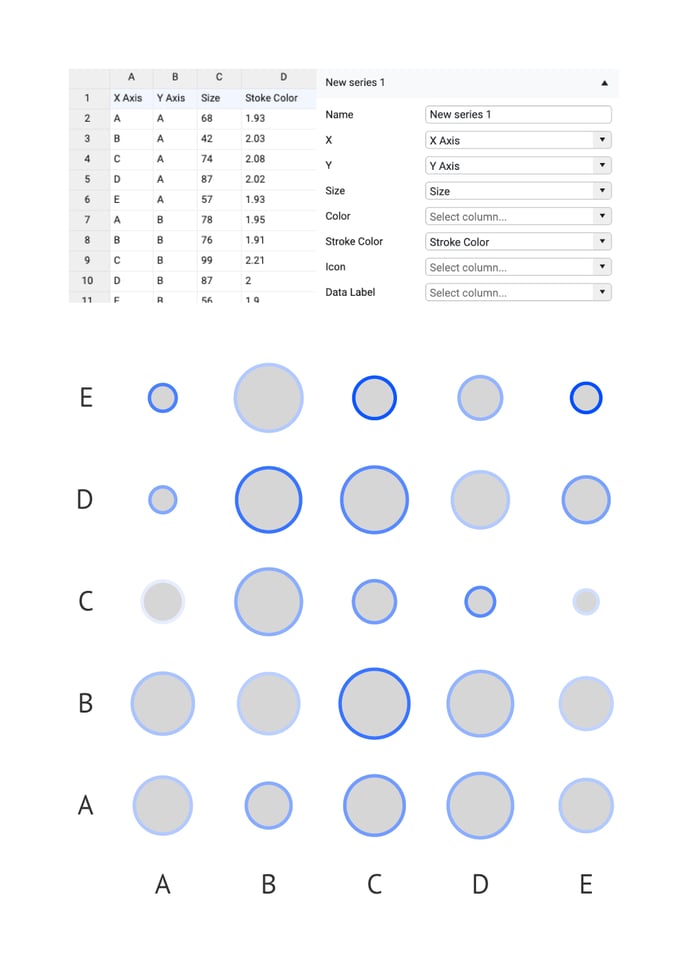
| Size | Used to bind the data to the size of the data mark. The bound column/row should contain only numerical values | 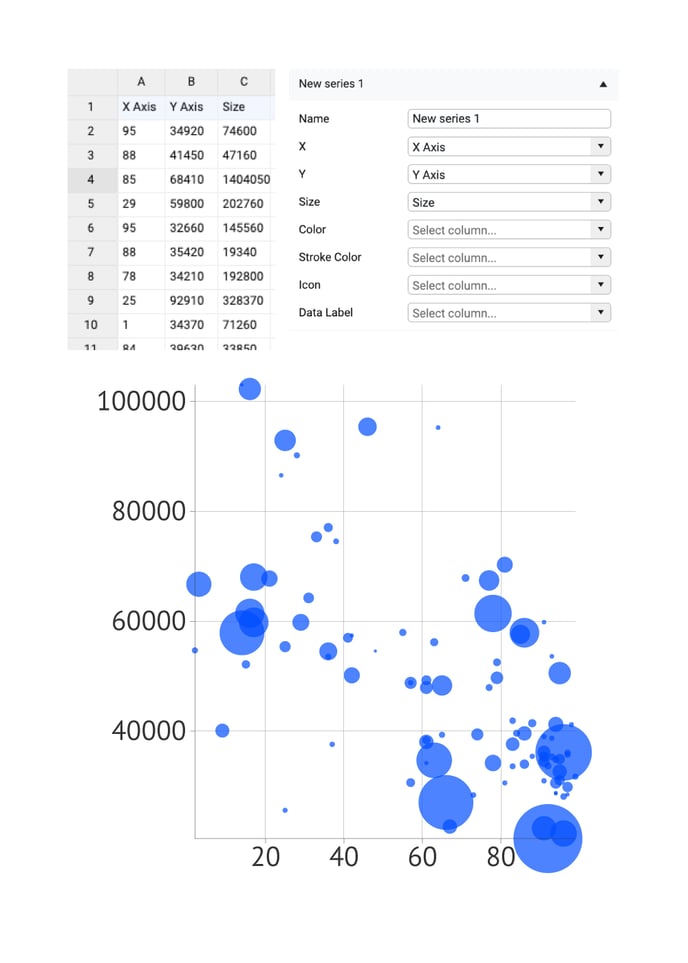 |
| Color |
Used to bind the data to the color of the data mark. The bound column/row can represent categorical, numerical, or datetime values. By default, it is formatted as a categorical value. The type of data can be adjusted in the Formatting tab. Colors can be also presented directly as HTML colors, HEX, RGB, or CMYK values. More on that in a specific article. To use direct coloring the color of data marks should be set to “None” under Styling > Data > Data Marks > Color. |
 |
| Stroke Color |
Used to bind the data to the stroke color of the data mark. The bound column/row can represent categorical, numerical, or datetime values. By default, it’s formatted as a categorical value. The type of data can be adjusted in the Formatting tab. Colors can be also presented directly as HEX, RGB, or CMYK values. More on that in a specific article. |
 |
| Icon | Used for direct binding. Data should contain the naming of an icon type. Possible values are listed in this article. | |
| Label | Used for direct binding. Data should contain the text for the corresponding data mark. | 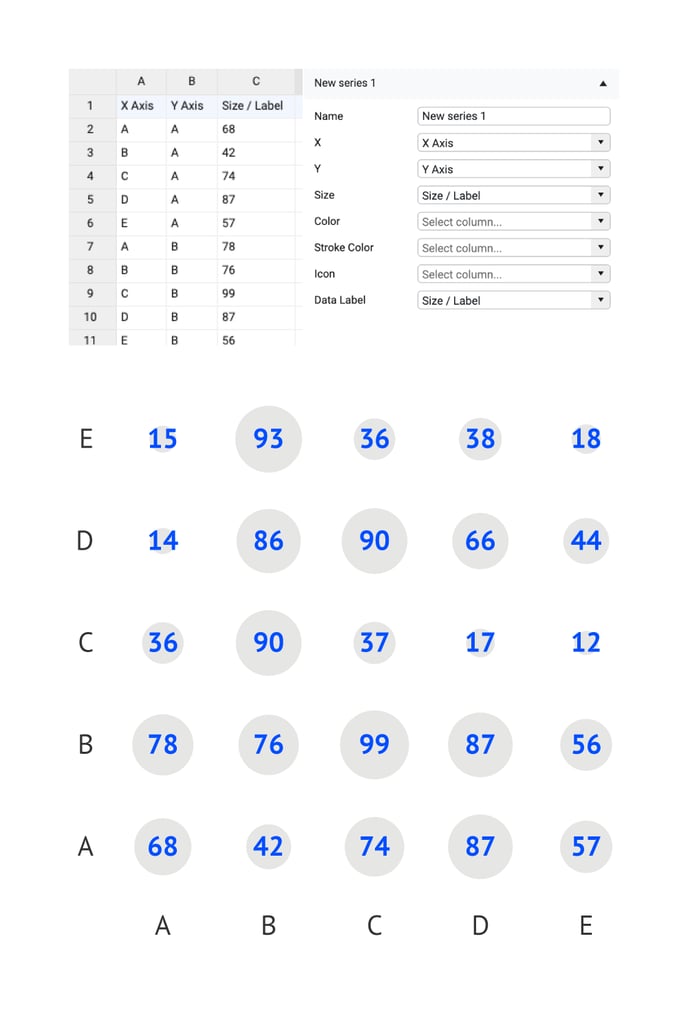 |
Styling Tab
DATA
Data Marks >
| Chart Orientation | Defines the X-axis as horizontal or vertical. | 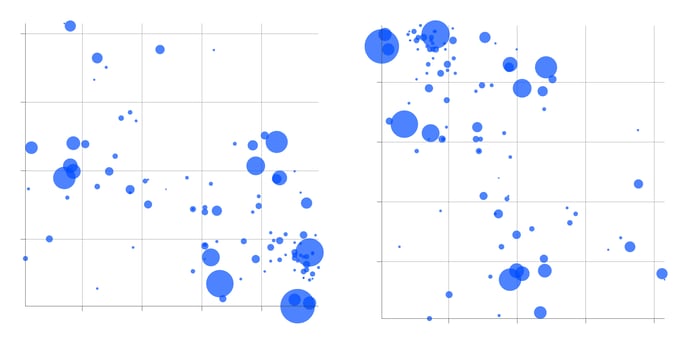 |
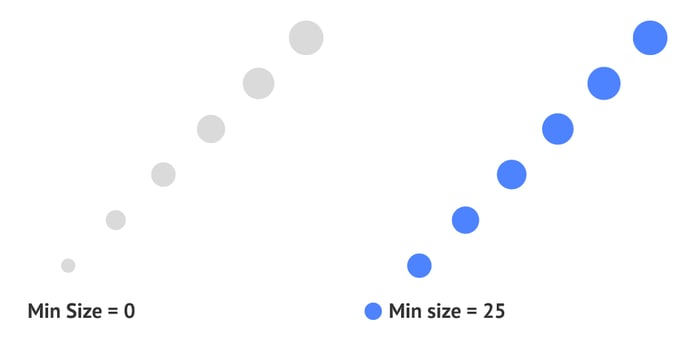
| Max Size | Set the size in width and height of the data mark with the highest value or to the Max Value if set. | 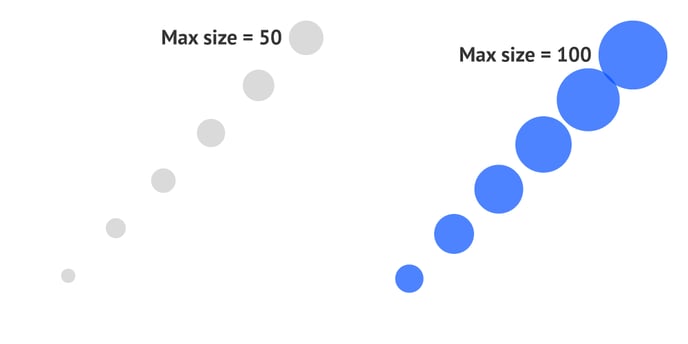 |
| Min Size (appears only when "Use Absolute Values" is turned off. |
Set the size in width and height of the data mark with the lowest value or to the Min Value if set. |
|
| Max Value | Sets the maximum value of the range that will be represented by the sizes of bubbles. It should be equal to or bigger than the highest value from the data range. | 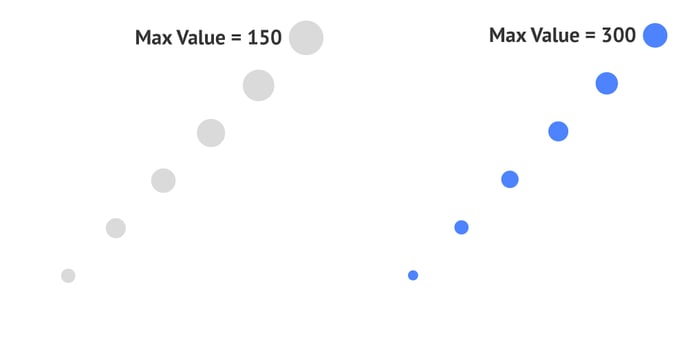 |
| Min Value | Sets the minimum value of the range that will be represented by the sizes of bubbles. It should be smaller than the lowest value from the data range. | 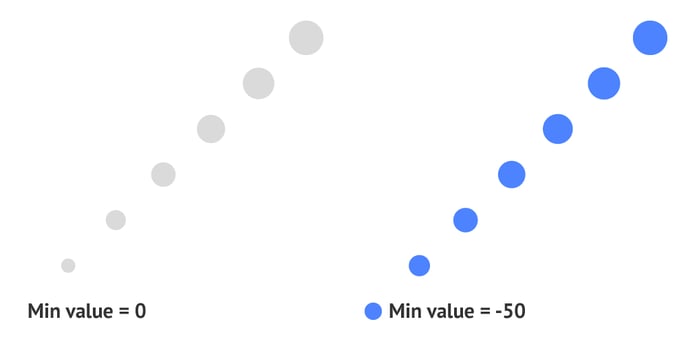 |
| Use Absolute Values | All the values from the data range are taken modulo. Meaning that f.e. 50 and -50 bubbles will look the same. | 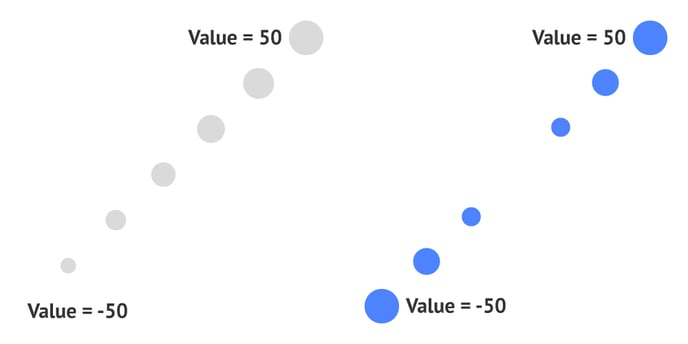 |
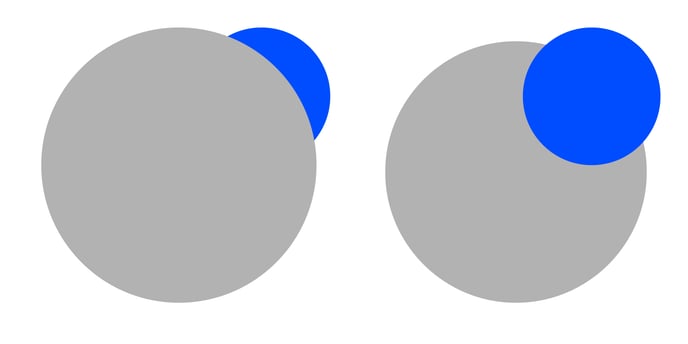
| Small Marks On Top |
When disabled, the marks are placed in order of appearance in the data, so the first line in the data is the first placed mark. When enabled, marks are placed relative to the size of the mark, smaller marks move to the front, bigger to back. |
 |
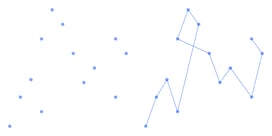
CONNECTOR
| Connector | Sets the color, weight, and dash properties of a line that connects all the data marks. Data marks are connected in the same order as presented in the data. |
 |
ANALYSIS
Trendline >
| Stroke | Sets the color and weight of the line. |
|
| Stroke > Cogwheel > Cap |
Sets the type of the line cap. There are two types available: Butt and Round |  |
| Stroke > Cogwheel > Dashed Line |
Applies a dashed stroke line when a number placed into Dash field. If no value added to Gap field the value from a Dash field applies as a Gap value. |
 |
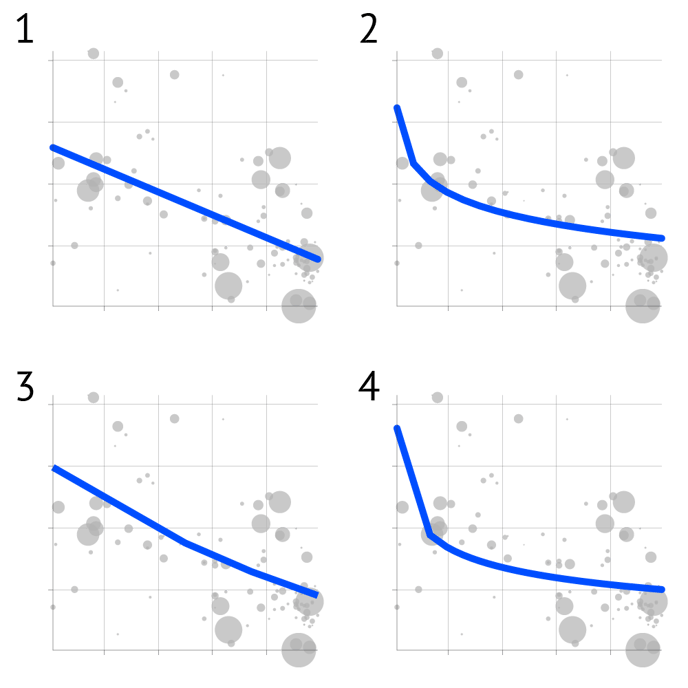
| Type |
Sets the type of the of the function that will be used to draw the trendline: 1. Linear |
 |

Back on Top
CALCULATION RANGE
| X Min | Sets the first value of the range that the trendline will be based on. By default it's the lowest value in the dataset. |
|
| X Max | Sets the last value of the range that the trendline will be based on. By default it's the largest value from the dataset. |
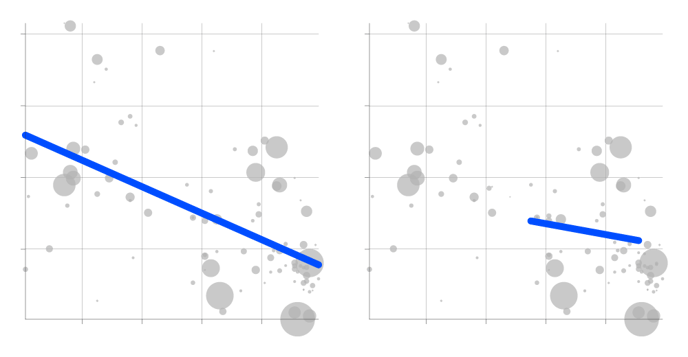
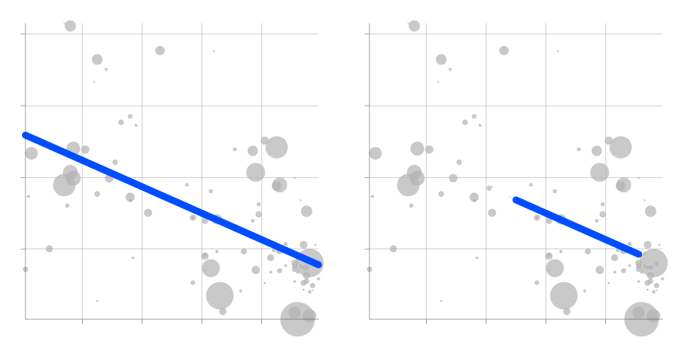
DISPLAY RANGE
| X Min |
Sets the first value of the trendline that will be visualised. Doesn't affect the calculation range. Warning: The display range can be extended beyond the calculation range, and as such creates only a graphical prolongation of the regression line. |
|
| X Max |
Sets the last value of the trendline that will be visualised. Doesn't affect the calculation range. Warning: The display range can be extended beyond the calculation range, and as such creates only a graphical prolongation of the regression line. |