Video walkthrough
Prefer to watch instead of read? Here’s a walkthrough showing all steps described below.
Text-based instructions
Error bars are not a standard feature yet in Datylon for Illustrator. In this step-by-step tutorial, we'll show a simple workaround on how to create an error bar.
- Start with a simple column chart.
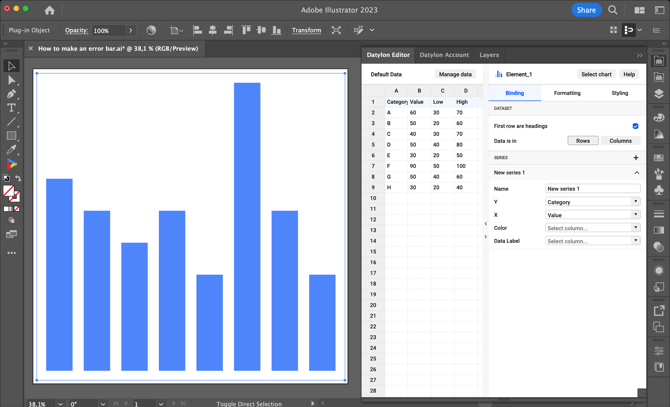
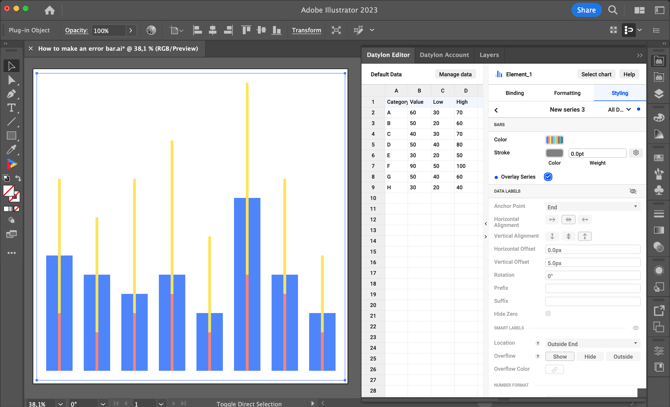
- Load and bind data for the bar itself, and the low and high values of the error bar.
Important: because the low and high values are stacked, the "High" column should contain the range above the low (High minus Low), not the absolute high value. In the example shown in the image, the bottom of the error bar is placed at 30, and the top is placed at 100 (30 + 70), not at 70 as you might expect.
For a clearer explanation, see the video walkthrough at the top of this article.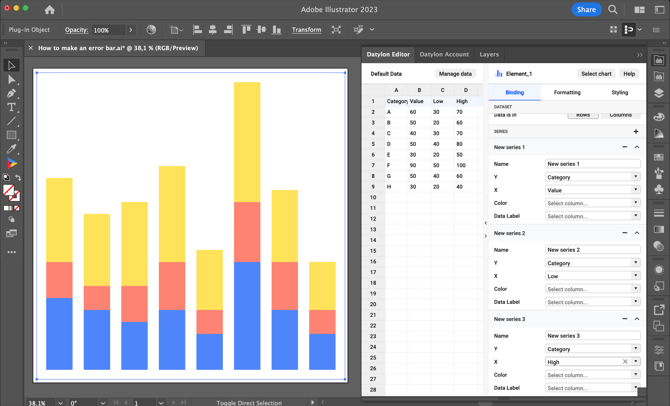
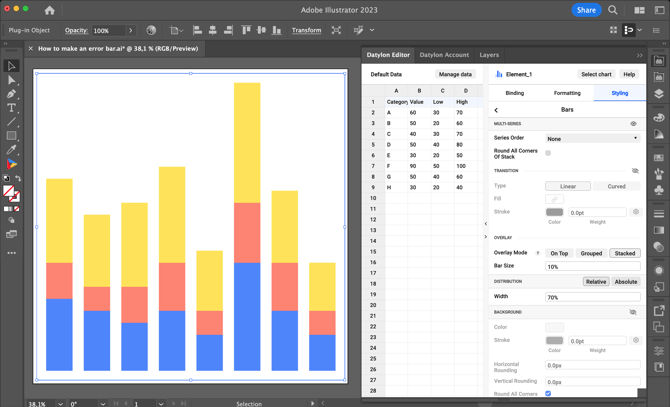
- Set the Overlay Mode to Stacked, and Bar Size to 10%
- Turn on the Overlay Series checkbox for New Series 2 and New Series 3 corresponding to the low and high values of the error bar.
- Set the Color for New Series 2 to None. Set the Color for New Series 3, here we use black.
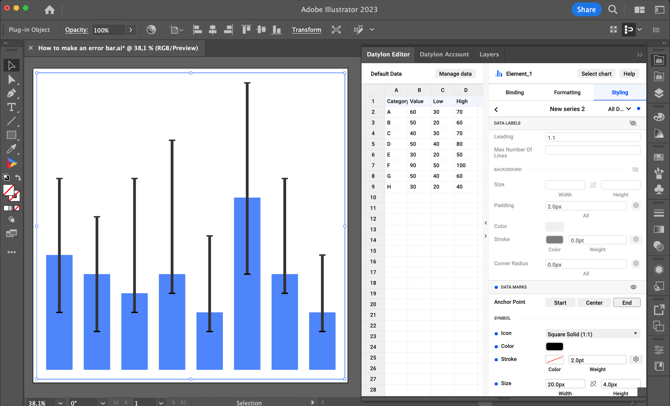
To create ticks for error bars, turn on Data Marks for New Series 2 and New Series 3. Choose the "Square Solid" Icon. Set the desired Width, and use Height to set the weight of the tick stroke. Set the Color to match the color of the error bar.
And you're done!