Introduction
The Datylon Report Server is a platform that allows organizations to automate the production of charts, dashboards, or complete reports based on graphically rich and on-brand templates created with Datylon for Illustrator.
The Datylon Report Server consists of the following components:
- Datylon for Illustrator
An Adobe Illustrator plugin to create advanced graphs and data visualizations. The resulting designs are exported as templates to the Datylon Report Server for automated data updates. Read more on Datylon for Illustrator https://www.datylon.com/product/datylon-for-illustrator - Datylon web app
State of the art web application allowing the user to create, view, style, manage and use templates exported from Datylon for Illustrator. New charts, pages, or reports are created based on these templates by binding new data sources to them. This binding process can be done manually or automatically using the Datylon Render Report Server API. - Datylon Report Server
A REST API addressable service that allows the user to render Datylon templates with new data and some rendering options, and retrieve the result as SVG, PNG, or PDF.
A separate article about how to build an automated reporting solution with Datylon Report Server can be found here.
Below you’ll find details on how to connect external applications by sending requests to the Datylon Render Report Server. For more information on creating templates with Datylon for Illustrator, click here.
Datylon Report Server
The Datylon Report Server includes the following features:
- Authentication of a request.
- Conversion of the request payload to a data structure that is used to render the template.
- Fetching the template from https://insights.datylon.com based on a Datylon template or design uuid.
- Returning the render result as the request response.
For proper authentication, you need a Datylon account with a password. A Datylon account created with a Google single sign on is not supported.
Tip: At first, start small. Use a template with a single bar or line chart and a small data set to get started with the integration service.
Render endpoint
To render a template with data, an HTTP POST request characterized by the following properties should be sent:
HTTP request and URL
Please contact Datylon via the contact form or getsupport@datylon.com to provide the URL and API key.
HTTP headers
HTTP header keys and values (except authorization) shall be in lower case.
- authorization
- Basic HTTP authorization header. E.g. assuming a Datylon account with email "me@acme.com" and password "secret", the header becomes
Basic bWVAYWNtZS5jb206c2VjcmV0
- Basic HTTP authorization header. E.g. assuming a Datylon account with email "me@acme.com" and password "secret", the header becomes
- content-type
-
- application/json → data should be provided as json (see further)
- accept
- image/svg+xml → return render result as SVG
- image/png → return render result as PNG
- application/pdf → return render result as PDF
- x-graph-template-id
- UUID of the Datylon template or design to be rendered, located on the Datylon Report Server.
- To retrieve this UUID, open the template or design in https://insights.datylon.com/create/stories and copy the alphanumeric string at the end of the URL.
- x-api-key
- Unique API key which will be provided on request.
URL/query parameters
There are some URL/query parameters available to set different output properties such as page dimensions, resolution, scale factor, background settings, etc.
Using the linked data source URL/query parameter, one can also use linked data sources (Google sheets) which are specified in the template as a data source, on condition no data is provided in the payload of the request.
Contact us at getsupport@datylon.com for more details.
HTTP payload
Max Size
The maximum size of the JSON payload is 128 MB.
Data
A sample of a JSON file of any workbook used, can be downloaded using either the Datylon for Illustrator plugin (Data manager > click the download button > JSON) or the Datylon web app (open a Design or a Template > click on the JSON button in the Attached Data section in below right corner).
It is essential the structure of the JSON file exactly matches the structure of the data used in the Datylon template.
If the ‘default workbook' is used when creating the template, it should be referred to as ‘main template datasheet container’ in the JSON payload.
Find below the JSON structure for use with the 'default workbook' :
{

  "main template datasheet container": {

    "name of first sheet": [

        ["row 1,col 1","row 1,col 2",...,"row 1,col n"],

        ["row 2,col 1","row 2,col 2",...,"row 2,col n"],

        ....

    ],

    "name of second sheet": [

        ["row 1,col 1","row 1,col 2",...,"row 1,col n"],

        ["row 2,col 1","row 2,col 2",...,"row 2,col n"],

        ....

    ],

    "name of third sheet": [

      ...

    ],

    ....

  }

}
Row x, col y refers to the values in row x, column y of the corresponding sheet.
Below an example in case of one or more other workbooks are used:
{
   "Name of first workbook":{
      "Sheet 1":[["Category","v1","v2"],["category1","12","14"],["category2","3","13"],["category3","43","12"],["category4","2","11"]]
   }
  ,"name of 2nd workbook":{
    "Sheet 1":[["Category","Value"],["A1","1"],["A2","50"],["A3","2"],["A4","50"],["A5","5"],["A6","32"],["A7","4"],["A8","6"],["A9","7"],["A10","8"],["A11","44"]],
    "Sheet 2":[["Cat 4","Val 4"],["aaa","44"],["bbb","44"],["ccc","44"]]
   }
  ,"Name of 3rd workbook":{
    "Sheet 1":[["v1","Value"],["c1","122.1"],["c2","443.9"],["c3","322.322"]]
    }
}
The number of sheets and the sheet names in the JSON should match exactly the number of sheets and names in the Datylon design/template. The sheet names are case-sensitive.
StylePatches in HTTP payload
The Datylon Report Server offers an API feature that enables you to modify specific properties of a chart using an optional StylePatches object within the JSON payload.
Please be aware that only the following properties can be adjusted:
- Hide/unhide of charts
- Number formatting options
"Visible" chart property
With this specific property, you can hide or show complete charts. This property can be applied to all chart types.
The data structure in the JSON to enable this feature is as follows:
"stylePatches" : {

"ChartName-1": [

{"op": "replace", "path": "/visible", "value": true}

],

"ChartName-n": [

{"op": "replace", "path": "/visible", "value": false}

]
}
- ChartName-n is the unique name of the chart as given in the Datylon editor (in the header of the Datylon editor next to the chart icon).
- "true" shows the chart, and "false" hides the chart.
- If the stylePatches object is used, the object "data" needs to be added before the data set. See below the example.
- When the stylePatches object is omitted, the chart keeps its original visible property as set in the template.
The "visible" property can be simulated in the Datylon editor by clicking on the eye icon next to Styling > General.
Note, the "visible" chart property is not added to the JSON which can be downloaded from the Datylon editor.
Number formatting options
|
Property name |
Type |
Possible values |
|---|---|---|
|
minus-sign |
string |
|
|
absolute-values |
boolean |
true, false |
|
add-plus |
boolean |
true, false |
|
decimal-separator |
string |
any string |
|
thousand-separator |
string |
any string |
|
short-notation |
string |
|
|
precision |
object |
|
Note that trailing "" in data might cause unexpected results
Examples
A separate article about how to build an automated reporting solution with Datylon Report Server can be found here.
On our inspiration page, you can open any design and download a JSON file as a sample.
Example 1
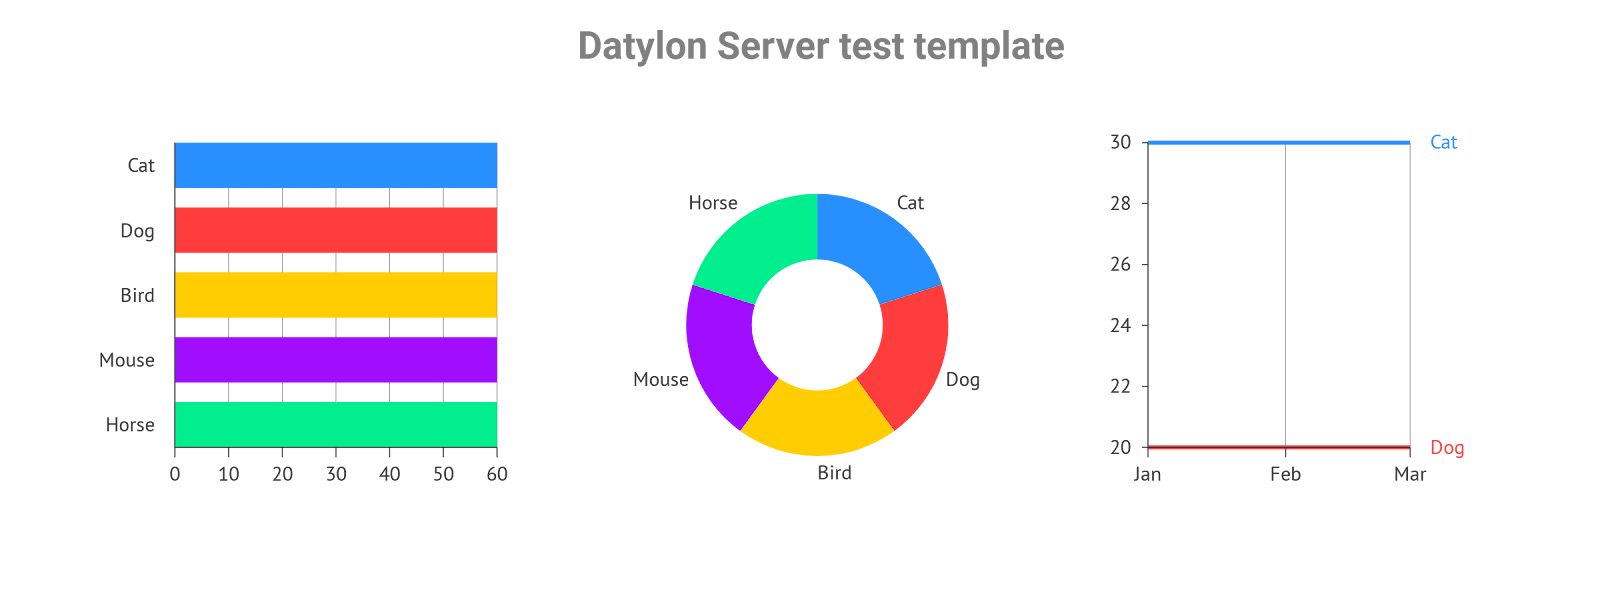
The template above with dummy data is rendered using the following URL, headers, and data sets:
- URL: To be provided. Please contact Datylon.
- authorization: Your Datylon account and password
- content-type: application/json. See data set below
- accept: image/png
- x-graph-template-id: 155d6153-4b8d-49d9-a8ba-d94417aa5111
JSON. Including the optional stylePatches object with the "visible" chart property all on "true".
{

"stylePatches" : {

"Linechart": [
{"op": "replace", "path": "/visible", "value": true}
],

"Barchart": [
{"op": "replace", "path": "/visible", "value": true}
],

"Piechart": [
{"op": "replace", "path": "/visible", "value": true}

]
},

"data" : {
"main template datasheet container": {

"line": [

["X","Y1","Y2","Y3"],

["jan","60","47","5"],

["feb","50","37","20"],

["mar","56","32","25"]

],

"bar-and-pie": [

["Category","Value"],

["Cat","60"],

["Dog","15"],

["Bird","9"],

["Mouse","5"],

["Horse","11"]

]

}

}

}
The response is the png below:

Example 2
Another example on how to use style patches including the number-format options on render-server. In the request body we have to provide the object with two properties stylePatches and data.
{
    "stylePatches": {
        "Bar Chart": [
            {
                "op": "replace",
                "path": "/datalabels/format/absolute-values",
                "value": true
            },
            {
                "op": "replace",
                "path": "/datalabels/format/decimal-separator",
                "value": "..."
            },
            {
                "op": "replace",
                "path": "/datalabels/format/precision",
                "value": {"value": 2}
            },
            {
                "op": "replace",
                "path": "/x-axis/labels/visible",
                "value": true
            },
            {
                "op": "replace",
                "path": "/x-axis/number-format/precision",
                "value": {"value": null}
            },
            {
                "op": "replace",
                "path": "/y-axis/number-format/precision",
                "value": {"value": 3}
            }
        ]
    },
    "data": {

    }
}
“Bar Chart” is the name of the chart we want to apply new style properties to.
“data” contains new datasource to render the chart.
Data security & on-premise deployment
Besides the cloud-deployed Datylon render service, accessible from ‘anywhere’, the render service can also be deployed on-premise as a Docker instance. This allows to set up a rendering workflow keeping privacy-sensitive data on-site while the templates are stored in the Datylon web app.
Such an architecture combines the advantages of secure cloud technologies with the requirement to keep sensitive data behind a corporate firewall at all times - the on-site deployed Datylon render service will retrieve the Datylon template from the web app through a secured channel and combine it with the provided data, rendering the result as one of the supported output formats.
Support
For support please use the contact form or chat in the Help Center, or email us at getsupport@datylon.com
Use this link if you'd like to book a demo with our solution architect and learn more about Datylon Report Server. Check this page for more information about Datylon Report Server and use cases.