Video walkthrough
Prefer to watch instead of read? Here’s a walkthrough showing all steps described below.
Text-based instructions
Legends are sometimes essential to understand charts, and just like charts, they are automatically updated when new data is uploaded.
Legends are available for Datylon Area, Bar, Dot Plot, Line, Pie and Scatter charts.
In order to utilize legends for Dot Plot and Scatter charts, it is essential to first bind your data to the Legend property in the Binding tab.
General
You can find legend properties under Styling > Legend for all of the charts mentioned above.
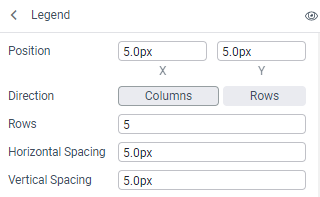
- Position defines the distance of the legend from the upper left corner in X and Y direction .
- Direction sets how legend marks will be placed: in columns or in rows.
- Depending on which choice is made in Direction, the number of rows or columns can be set in Rows or Columns.
- Horizontal Spacing and Vertical Spacing define the distance between the legend marks.
The horizontal distance between legend marks is added to the offset of the labels (Labels > Horizontal Offset) and the paragraph width of the labels (Labels > Paragraph > Width). So the total horizontal distance between the legend marks is the sum of the horizontal spacing + the horizontal offset + the paragraph width.
The total vertical distance is the sum of vertical spacing + vertical offset.
Background
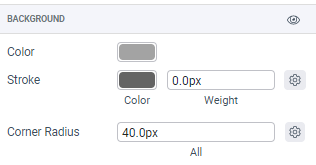
Here, the Stroke, Color and Corner radius of the legend background can be set.
Padding
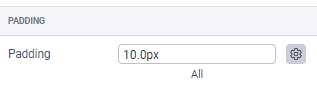
Padding determines the size of the background and therefor adds also to the position of the legend set in the general property Position.
Symbols
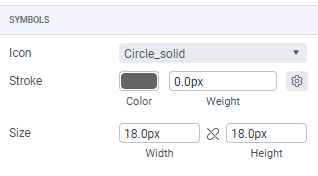
Here you can style marks, or symbols, used in the legend. Icon type, its stroke and size can be changed. The (x:y) indication behind the Icon name in the list, refers to the proper ratio of the icon. So Man (1:2) e.g will need to be twice as high as wide to shoe the ratio as designed. Any other ratio can be used, but will distort the shape.
Labels
In the labels properties section, you can change multiple properties of legend labels similar to any other label in Datylon Graph.