How to add a reference band to a line chart
Learn how to create reference bands with Datylon Line chart to focus attention on a certain part of your chart
A reference band in a chart or graph is a shaded area underneath the data marks between two constant or varying values on the axis. See the red area in the line graph below. A reference band is made by means of a Datylon Line chart, but can be combined with any other chart using Datylon for Illustrator. Click here to learn more about combining charts in Datylon for Illustrator.
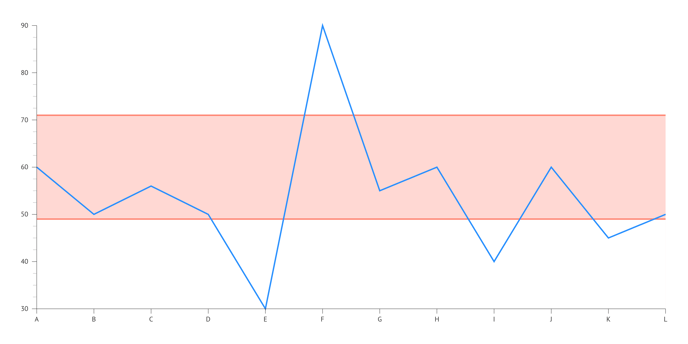
To create a reference band you'll need to add two additional lines to your chart. the first line represents min value or the bottom of the band, the second line – max value or the top of the band. To fill a band with a color you need to apply Styling > Line > Fill Area Below for both lines: the bottom line fill area color should be the background color, usually white. The top line fill area color should be the actual band shade.
Step by step
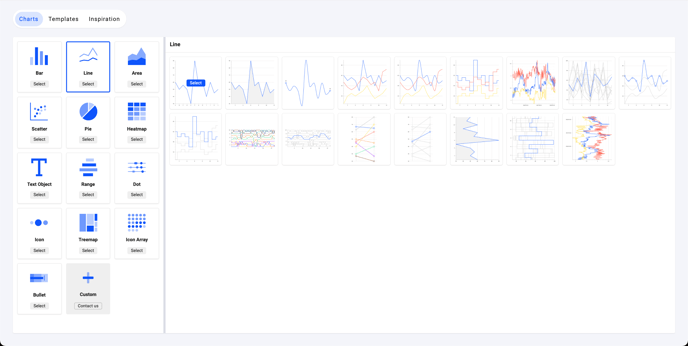
1. Create a Datylon line chart by selecting one of the line chart templates
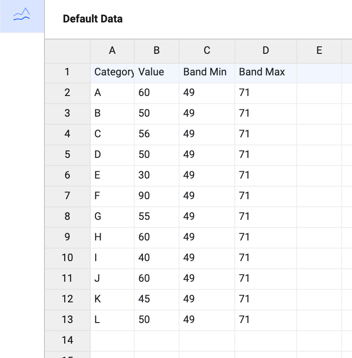
2. Add data for the min and max band lines
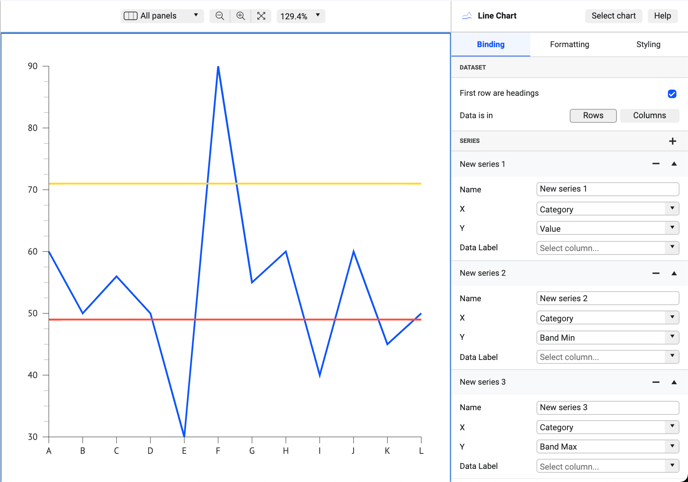
3. Create new series for band lines under the binding tab and bind the data
4. Go to Styling > Series and style min band line. Set Fill Area Below to white (or another background color)
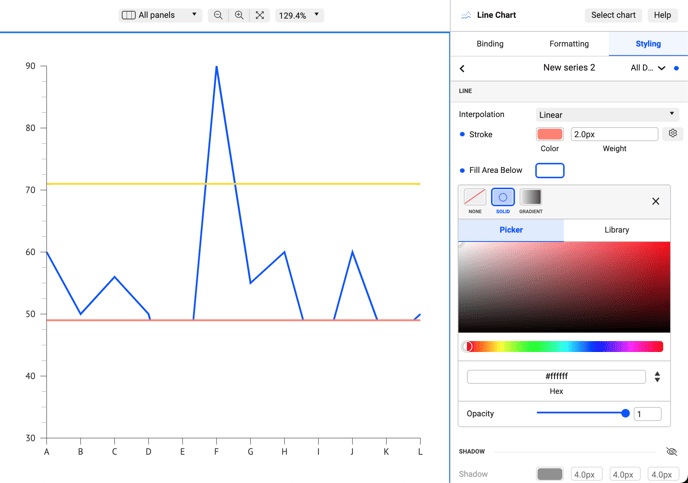
5. Then do the same for the max band line. Set Fill Area Below to preferred band color.
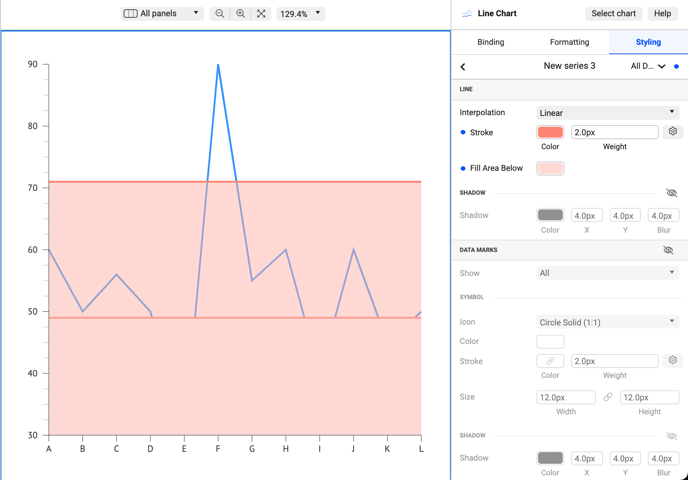
6. Change the main line to solid color.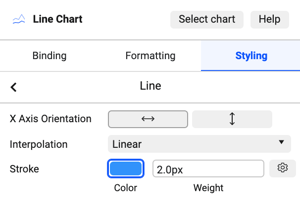
7. Then re-arrange series using drag and drop in the following order: max band line is on top, then the min band line, and then the main line.
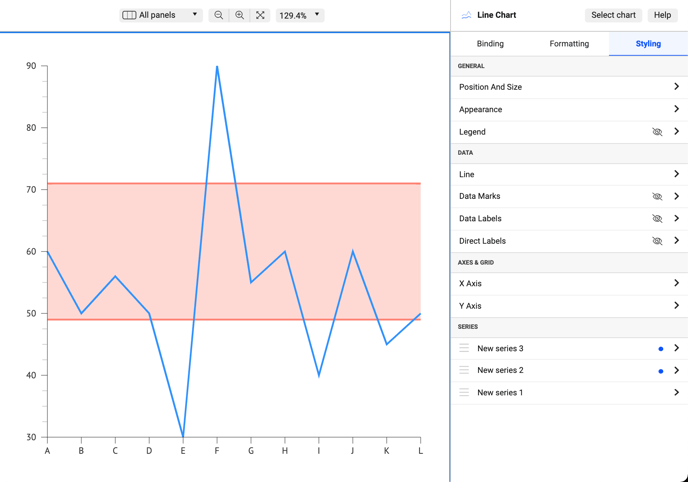
And we're done!