Datylon R41 - Release Notes | 2020 Aug 06
New features in Datylon for Illustrator & Datylon web app:
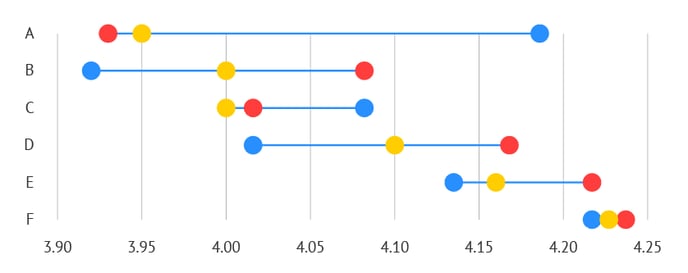
Added new chart: Dot plot

a.k.a Dot chart, range plot, categorical scatter or connected dot plot, the Datylon Dot plot is an easy to read chart, visualizing two or more numerical values per category in a very space-efficient way. See more variations like a dumbbells chart on our Inspiration page.
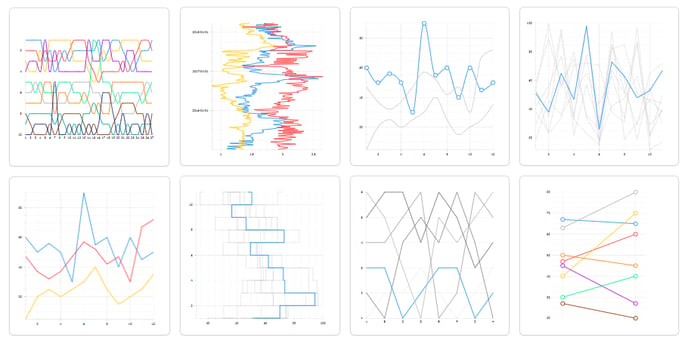
Added new default charts
The Datylon chart editor now comes with a broad set of new defaults for all chart types which provide a wealth of inspiration to create attractive and engaging charts. These defaults also demonstrate how standard chart types can be used to build many different variations.
