Datylon R39 - Release Notes | 2020 Jun 08
New chart and features in Datylon for Illustrator
Online Collaboration with Datylon web app
We have renamed Datylon Graph into Datylon for Illustrator and boosted it with even more charts and features. On top of that, Datylon now also helps you to collaborate online with the Datylon web app:
- Upload charts or report templates from Datylon for Illustrator for other people to use, edit and update with new data, without losing your styling efforts.
- Publish your charts or online, share your reports via email and social or embed them on blogs or websites.
- Via our API, the reporting workflow can also be automated and integrated with a 3rd party app or workflow
Datylon R39 chart editor highlights
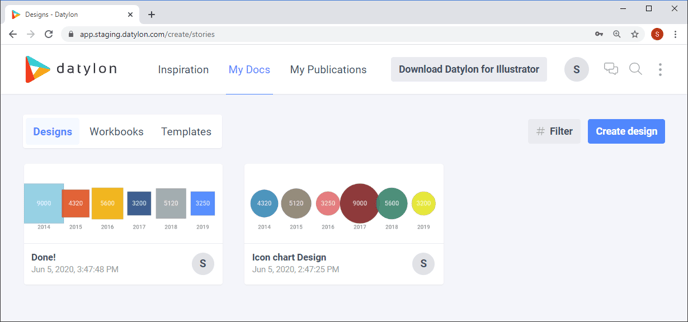
New Chart: Icon chart
Icon charts are great for showing your audience an overall comparison of usually smaller sets of data. Different icon types in relative sizes and data driven coloring give extra dimensions to this chart. Properties that are very popular in business communication or media.
And as with all Datylon charts, you have full creative flexibility to style it in all its details. Find more information [here].

New features
- Negative text tracking in labels, to fit the text in the data marks
- Palettes can be filtered down to 2 colors, useful for bar & column charts with pos/neg values
- More stroke options around and between slices of a pie and donut chart

Datylon web app
With your Datylon account, you have access to the revamped Datylon web app.

While templates uploaded from Datylon for Illustrator can easily be updated online with new data, one can now also create single charts from scratch. These charts can then be saved in the web app and shared with others or exported as pdf, svg and recently also png.
See how to get started with the Datylon web app in this video, and learn about the differences with Datylon for Illustrator.