Datylon R35 - Release Notes | 2020 Jan 17
Version
- Datylon Graph for Adobe Illustrator: Beta v0.35.0
- Datylon Insights: Beta v0.35.0
Highlights Datylon Graph R35
- We started implementing legends! Try them out on the Bar, Pie, Line and Area charts.
Find more info here.
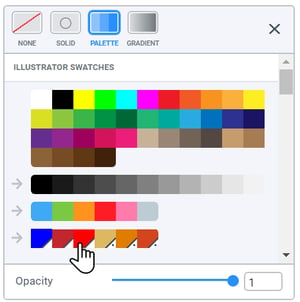
- Datylon Graph now supports global colors created in Adobe Illustrator.
This means you can change colors in multiple charts at the same time. Both the spot and global process colors can be selected from the Datylon Graph palette. See this article for more information.
- D3 palettes added. In RGB document color mode only.
- Improved user interface
- Reset series properties to global style. A little gem which saves you a lot of time! Learn how to work with series and reset here.
- Shift key square constrain when dragging chart area
- Default to global values for Series styles when undefined
- Correct Illustrator behavior Paste in Place of Datylon charts
- Various bug fixes.