Datylon R32 - Release Notes | 2019 Oct 31
Datylon Graph, Datylon Insights Editor
Version
- Datylon Graph for Adobe Illustrator: Beta v0.32.1
- Datylon Insights Editor: Beta v0.32.1
Datylon Graph v 31.1 is compatible with Adobe Illustrator 2020 (v24). However, Datylon charts created in Illustrator 2020, cannot (yet) be edited in Illustrator 2019.
Highlights Datylon Graph
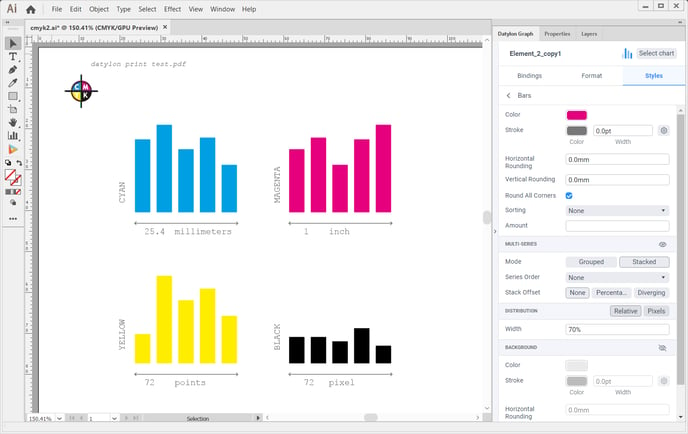
Datylon Graph now supports CMYK color mode and most common metric or imperial units for print production.

- The color mode is document dependent and set in Illustrator by File>Document Color Mode. Most of the features are exactly the same in both color modes. However, CMYK mode is still work in progress, so please be advised about the following known limitations:
-
- After starting up Adobe Illustrator, and creating or manipulating a Datylon chart for the first time, there is a delay noticeable of several seconds before rendering. After that, charts are rendered as normal until you close and re-open Illustrator again.
- One cannot change the color mode of a document once Datylon charts are placed in that document. Copying charts from an RGB to a CMYK document or vice versa is however possible.
- Color binding -if supported by the chart type- in the bindings tab is possible. However for now, colors can only be defined by HEX codes and color names, not CMYK values.
- Export to Datylon Insights is now blocked if document is in CMYK color mode.
- Gradients are not supported yet.
- Drop shadows are not supported yet.
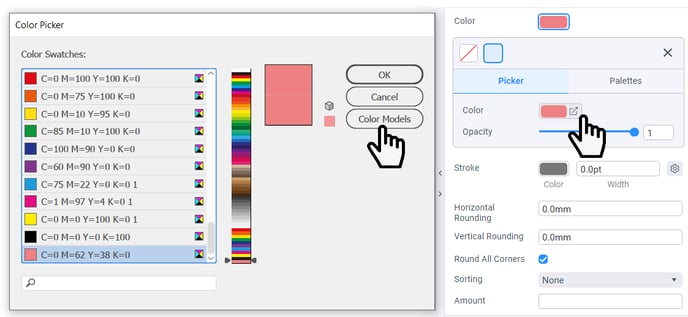
- Registration color swatches and global colors are not shown in the color palette. They can be selected though by opening the Color Picker>Color Swatches in the Datylon Graph panel (see below), but these colors will not keep their global behavior in the charts.
- On general request, the units set in the Illustrator menu Edit>Preferences>Units are now applied to the relevant properties in the Datylon Graph panel. You can set different units for strokes, type and general dimensions.
- And of course, reported bugs are fixed.
Highlights Datylon Insights
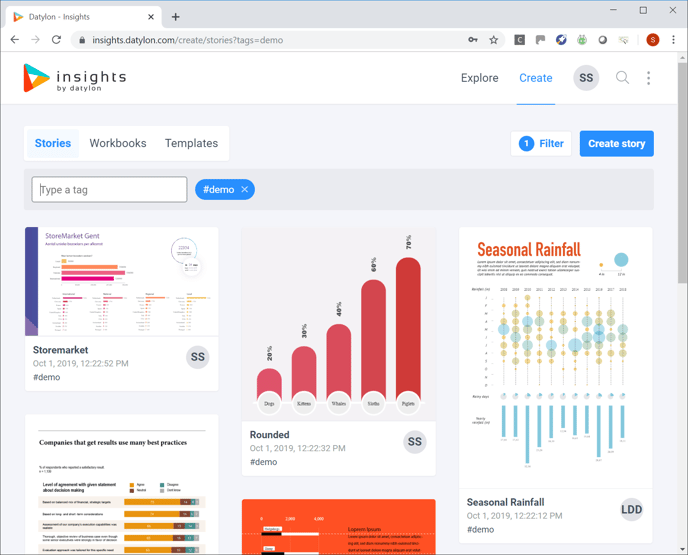
- Added more samples and demo charts which can be found here.
- In the description of data stories, tags can be added preceded by #. If so, they can be used as filter in the explore views.

