How to create chart titles in Datylon for Illustrator
How to create axes names, chart titles, annotations and many more using Text object in Datylon for Illustrator.
Axis titles can be added using the standard Adobe Illustrator text tool. This allows you to use all the Illustrator text features.
On the other hand, if you want to make the titles, axis names, and subtitles data-driven, you can use a Datylon Text Object (one of the chart types) and bind it to another column/row in your data with the wanted text. The main limitation here is that the text cannot be rotated.
Every newly created Text object will have a separate data sheet connected to it by default, but it can be more convenient to use the same data sheet for the chart and for all the additional text elements.
Step by step
In the example below a chart title and the axes' names will be created using the Datylon Text object.
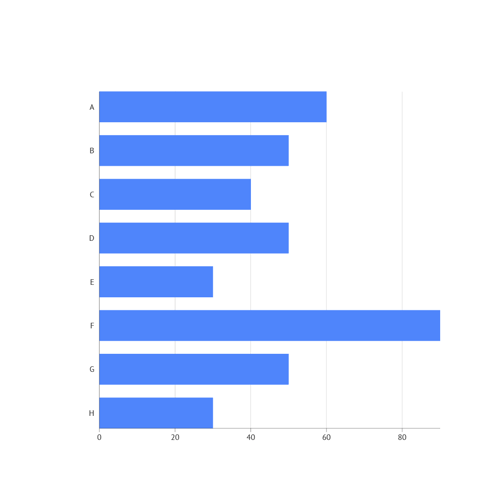
- Drag a chart on the artboard and leave enough space around for a title and axes names.

- Add column names and enter the chart title and axes names as text. Note that each line in your column represents a paragraph. This allows you to add titles to multiple paragraphs.

- Create and place the Text object for the chart title.

- Change data sheet to the "main" data sheet: Go to Manage data > Select the "main" data sheet > Select sheet

- Bind your title column to Text field

Note: if you'll get this warning go to Styling > Chart > Margins and reduce margins.

- Now you can style the text by color, size, paragraph settings, etc. Note that if Font > Fit checkbox is on, the text will fill the whole chart area. In this case, you can change the font size by changing the size of the chart area. If Font > Fit checkbox is disabled, the size of the font corresponds to the value in the font size box.

7. Follow the same steps for both axes' names and you're done!
