What is an empty cell?
Sometimes there are blank or empty cells in data which could still be significant for the visualization.
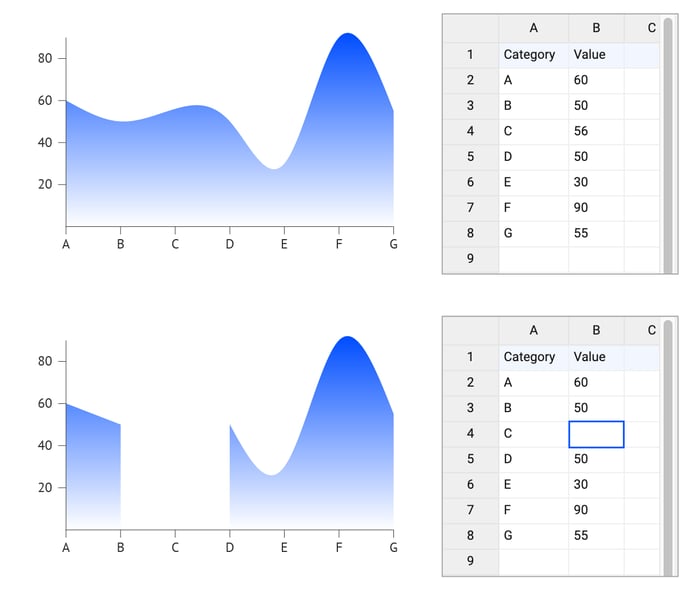
Missing data, empty or blank cells refer to cells in the data sheet which are located within a column or row of actual data that is bound to a property in the Bindings tab. In the below example, cell B4 is an empty cell. Column C and further right, or row 10 and below are not. Empty cells can occur in category data, property data (e.g. color) or values.
Every chart type can have its specific behaviour, but below is a generic description on how empty data points are rendered in Datylon charts.
Empty cells behavior
Unless there is no data at all, empty cells within a correct data set will always give a result in a Datylon chart, without causing an error.
Depending on what axis is used, behavior of empty cells can be different.
Categorical Axis
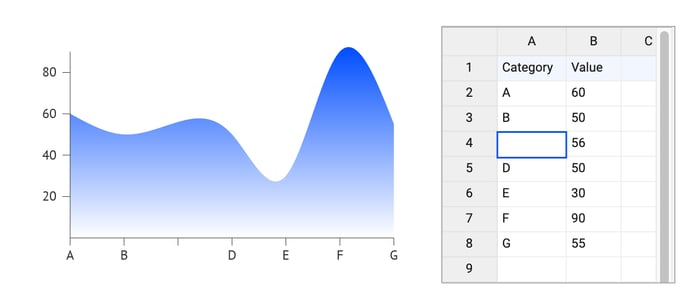
If an empty cell is a part of a row/column that is bound as a categorical axis, then an empty category is created. A value corresponding to that empty cell is plotted and assigned to the empty category. Note that if there are multiple category rows/columns containing empty cells, all the values are added into one blank category.
Numerical and Datetime axis
If an empty cell is a part of a row/column that is bound to the numerical or datetime axis then no value will be plotted. In case of line or area charts, the data points will not be connected.