Datylon for Illustrator or Datylon web app
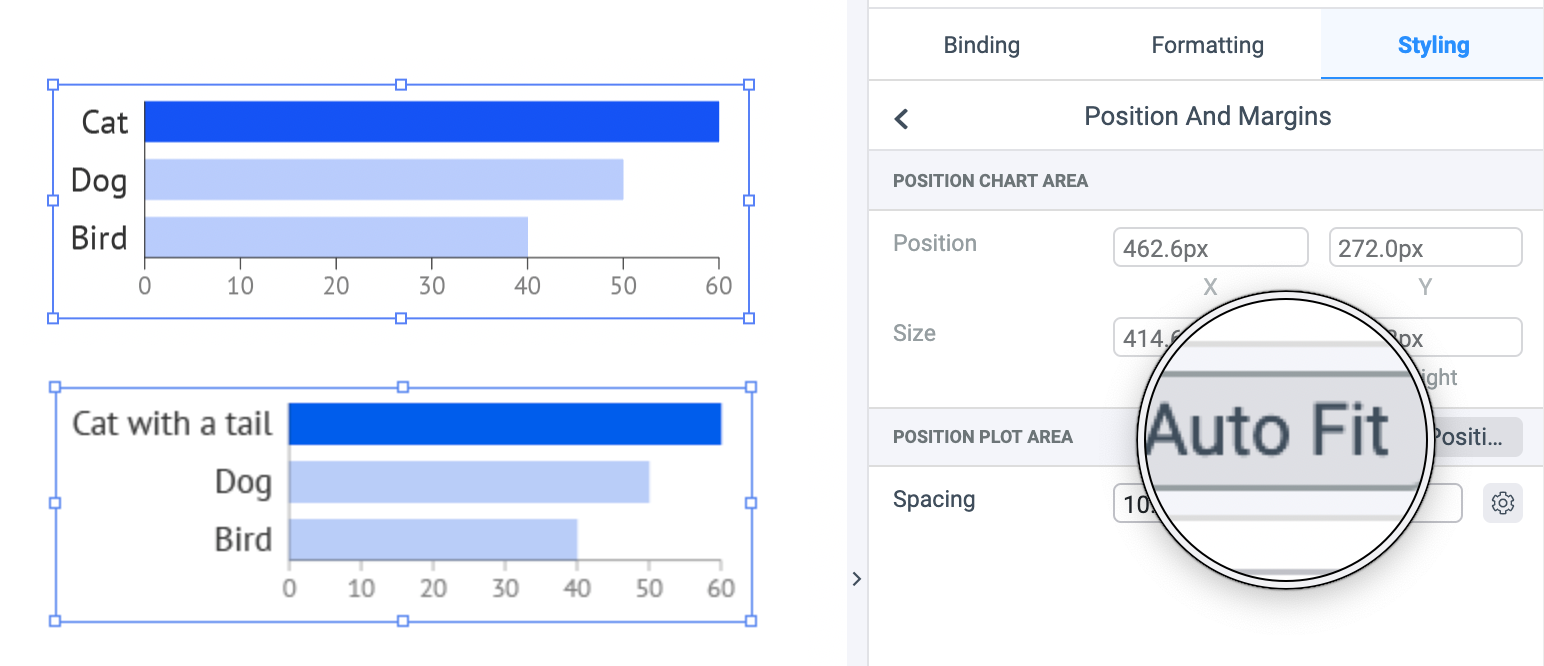
Auto Fit
With Auto Fit enabled, the plot area of your chart will automatically resize to fit the labels within the boundaries of the chart area. Spacing can be added on all sides or each side separately.
In case the position of the plot area versus the boundaries of the chart area needs to be constant, for instance to align multiple charts, use Fixed Position. The distance between the plot area and the chart boundaries can be changed in Margins.
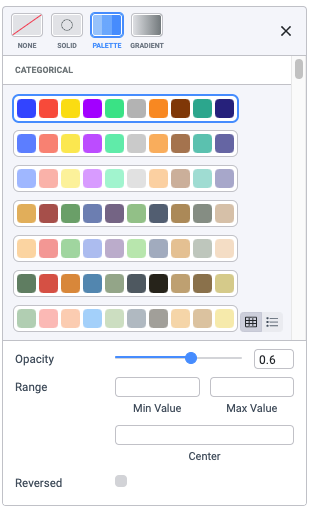
New color palettes for better readability
New default color palettes have been added with elegant contemporary colors optimized for data visualizations.
Miscellaneous
- Text object
Empty cells in the data returned an error. Now it visualizes an empty Text object. - Icon chart
improved sizing, padding and distribution behaviour.
Use Styling > Icons > Distribution. - Pie chart
Option to hide categorical labels when corresponding value is zero.
Use Styling > Category Labels > Hide When Zero. - Arrow chart
Improved label positioning behaviour.
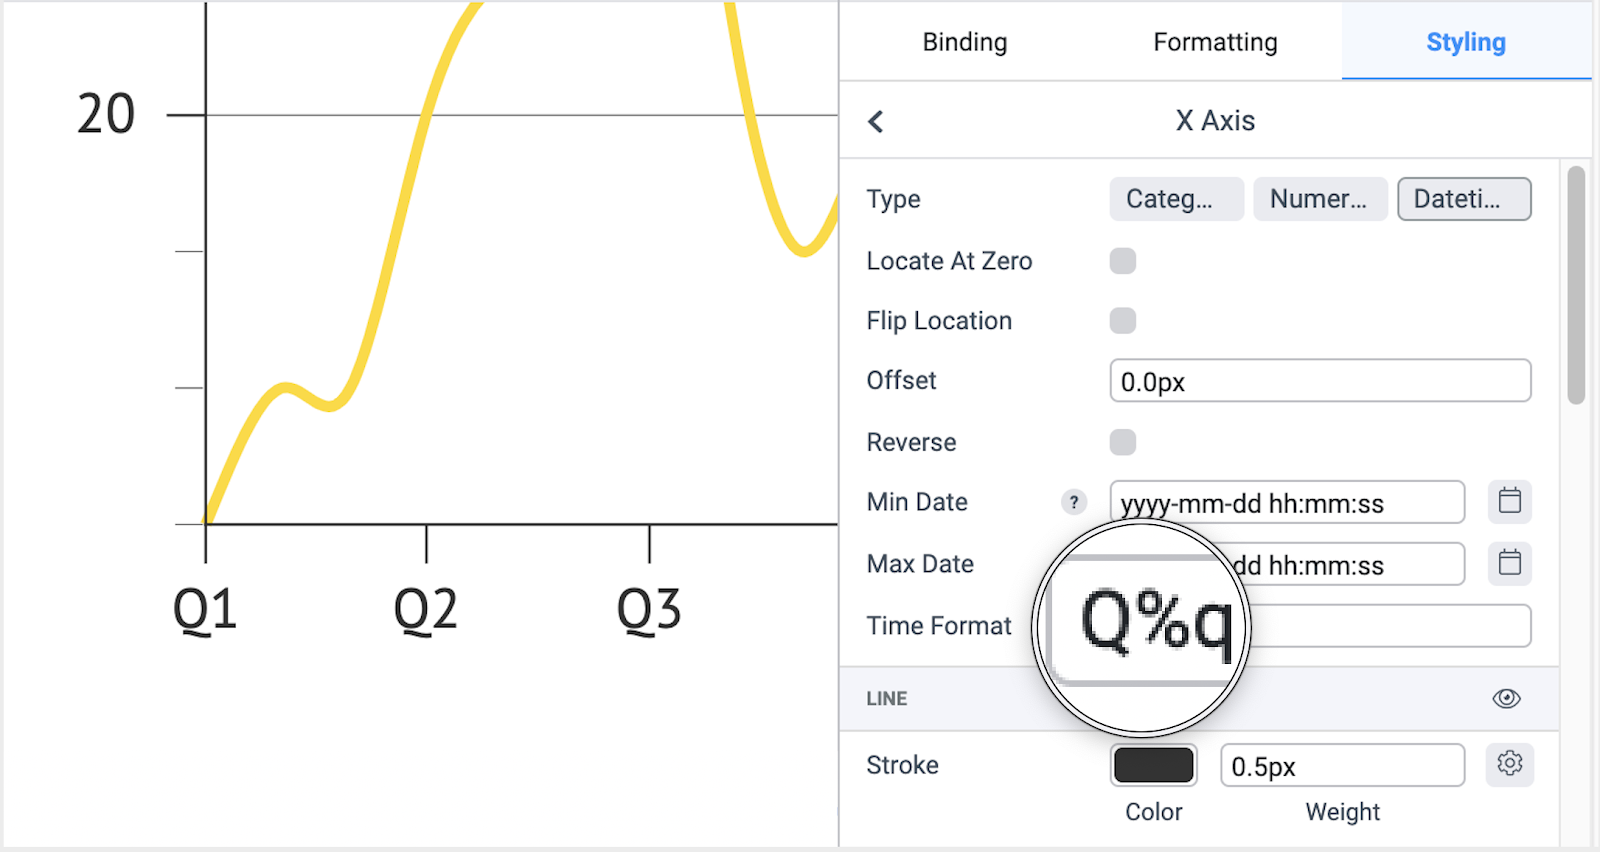
Use Styling > Data Labels > Horizontal/Vertical Offset. - Quarter axis labels
If your data is delivered in any kind of date format, you can style your axis labels as quarter numbers. Use Styling > X or Y axis > Type: Datetime > Time Format: %q
You can add any text before or after the "%q". It this example we added a "Q" in front.