Many properties in the DATA section can be set overall for the whole chart, but also separately on data point level. See data point styling for more details.
Binding Tab
1 Dataset
2 Series
Styling Tab
General
1 Position and Size
2 Appearance
3 Legend
Data
4 Area
5 Data Marks
6 Data Labels
7 Direct Labels
Axes and Grid
8 Axis > Type: Categorical
9 Axis > Type: Numerical
10 Axis > Type: Datetime
Binding Tab
Dataset>
| First row (column) are headings |
When enabled, the first row (column) of the dataset are headings. When disabled, the first row (column) of the dataset is included in the data range. |
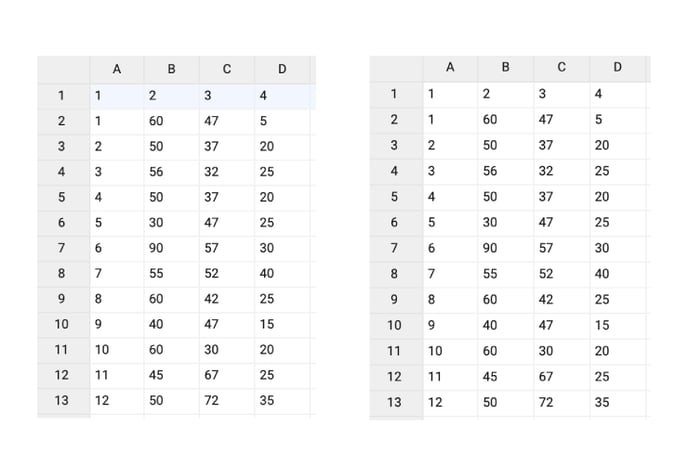 |
| Data is in | Sets the way data is structured: in rows or columns. | 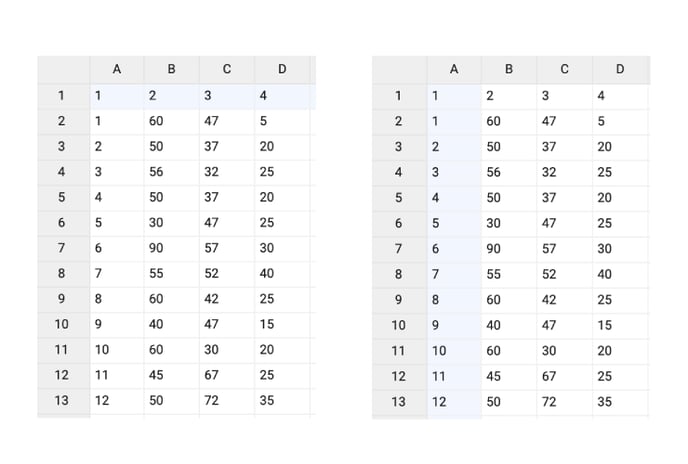 |
Series>
| Name |
Text field to name the Series. By default, it is set to “New Series n”. This name is used for Direct labels. |
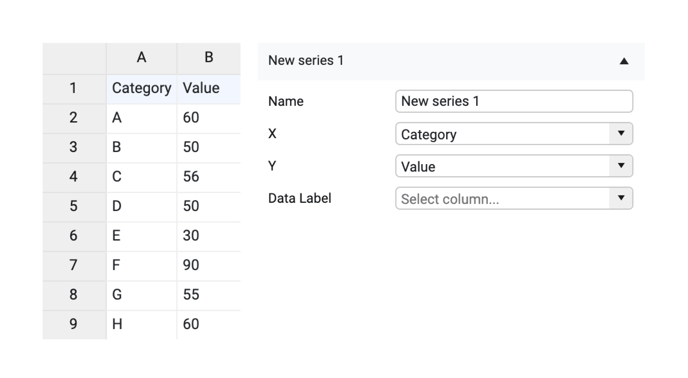 |
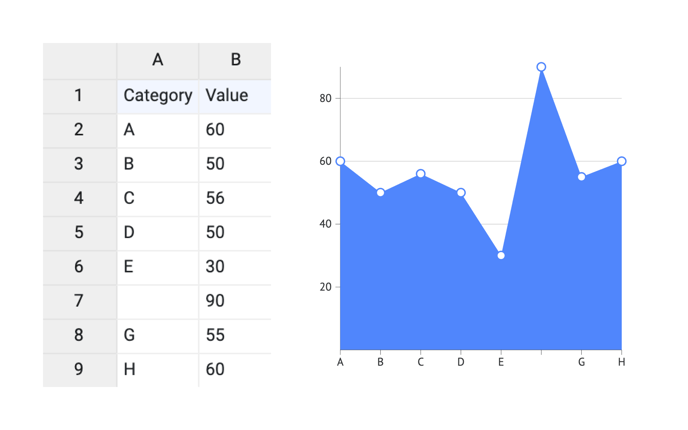
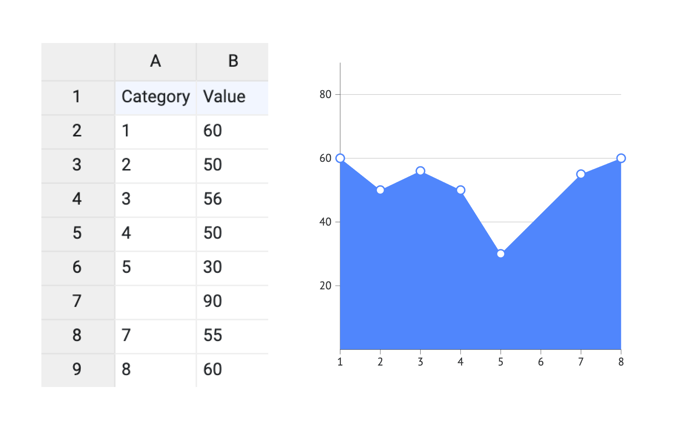
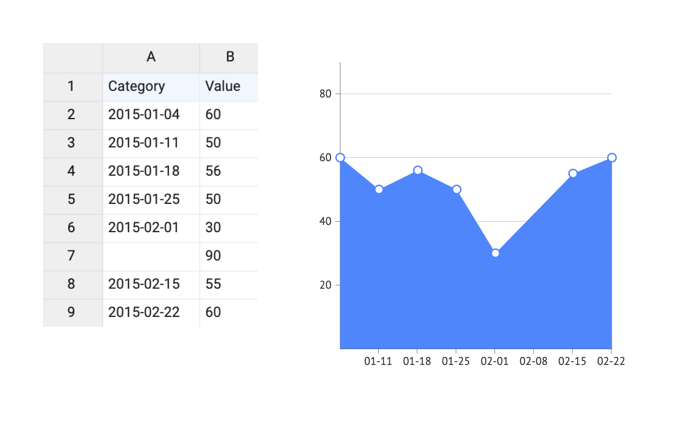
| X |
X-axis can be used for binding 3 types of data:
|
 |
|
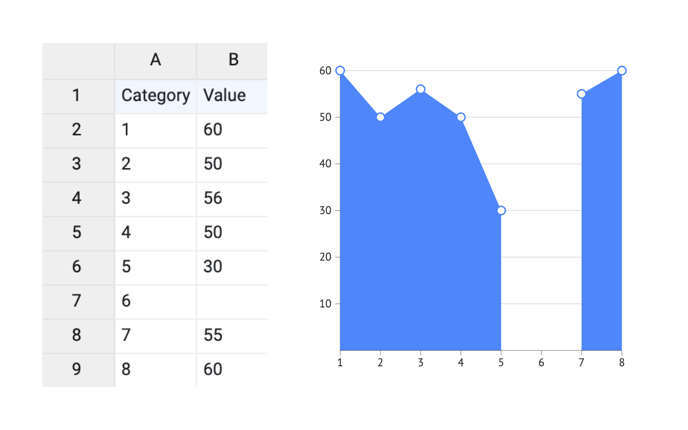
One or more empty cells in the X-axis data will give the following result:
|
1
2
3
|
|
| Y |
Y-axis can be used for binding 3 types of data:
|
 |
|
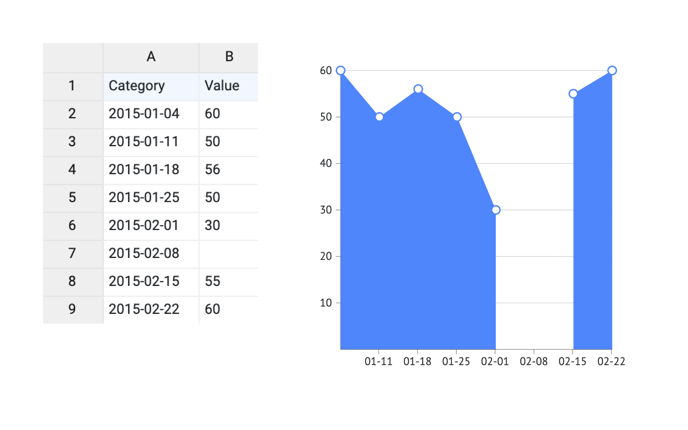
One or more empty cells in the Y-axis data will give the following result:
|
1
2
3
|
|
| Data Labels | Adds the content of a bound column (row) as a label for the corresponding data point | 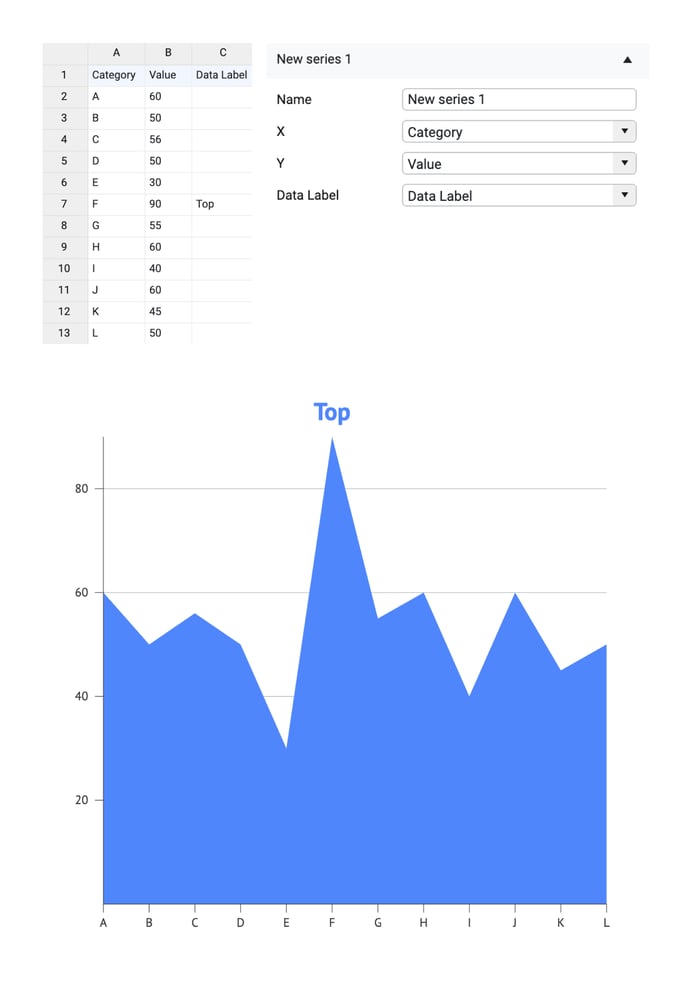 |

Styling Tab
DATA
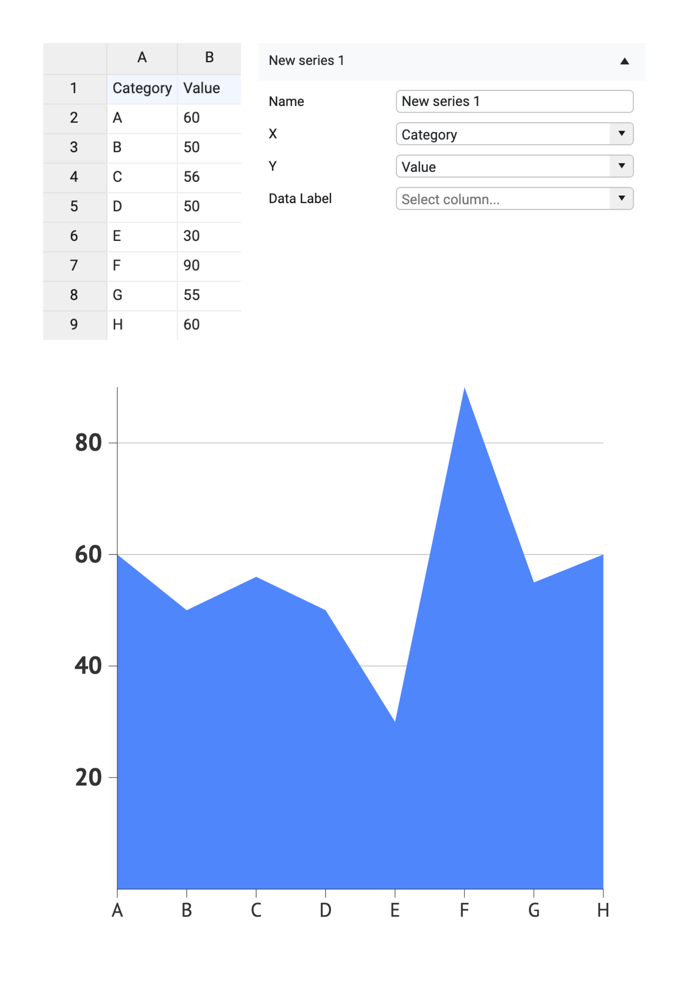
Area>
| Chart Orientation | Defines the X-axis as horizontal or vertical. | 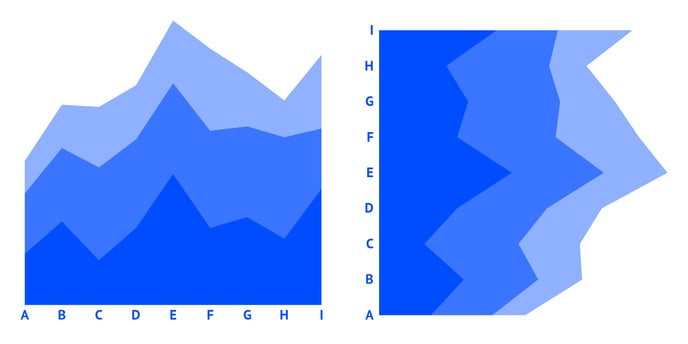 |
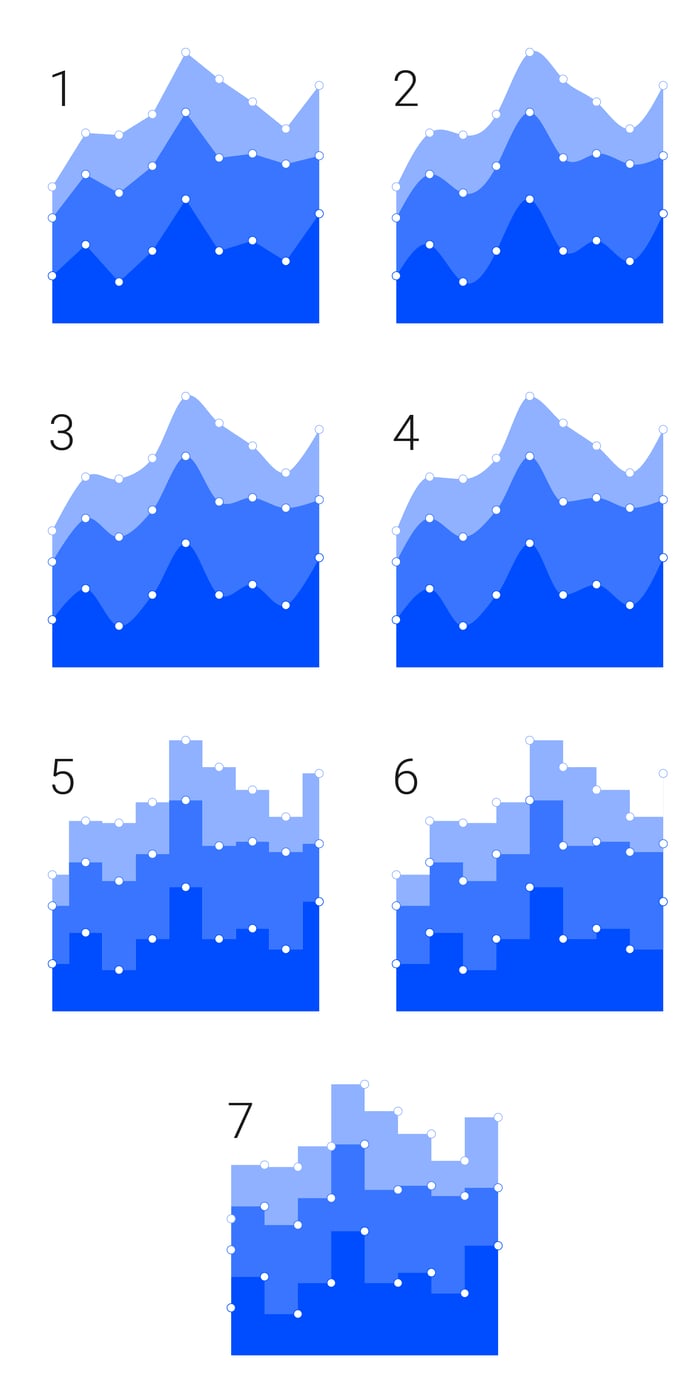
| Interpolation |
Sets the construction method of connecting the line between data points. There are 7 options available:
|
 |
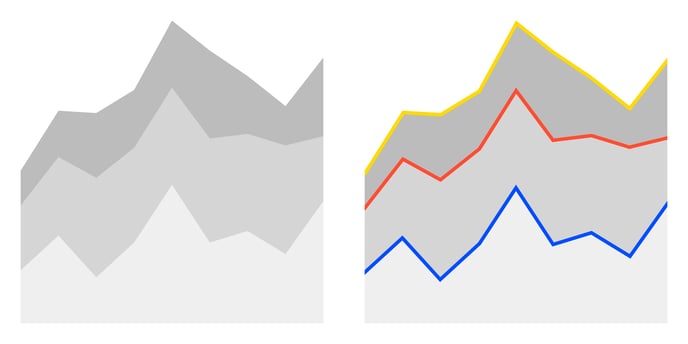
| Color | Sets the color of the area. |  |
| Stroke |
Sets the color and weight of the line on top of the area. You can apply a dashed stroke by clicking the cogwheel. |
 |
MULTI-SERIES
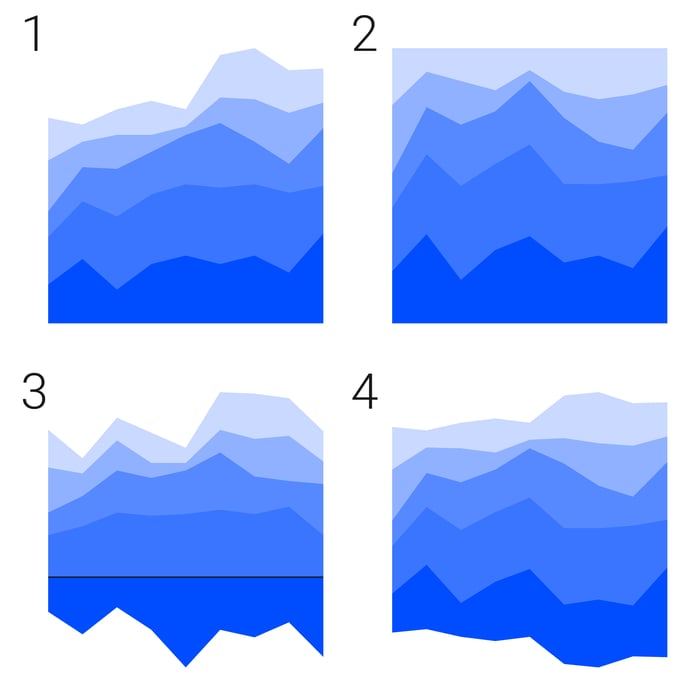
| Stack Type |
Sets the way areas are stacked.
|
 |
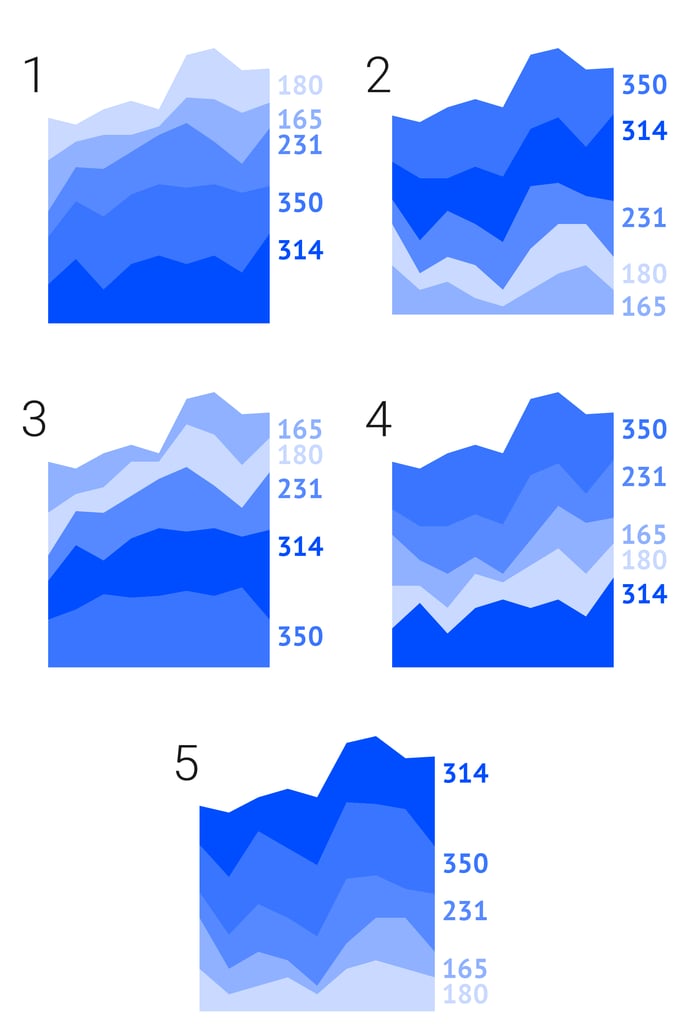
| Series Order |
Sorts series based on their total area value. There are 5 options available:
|
 |
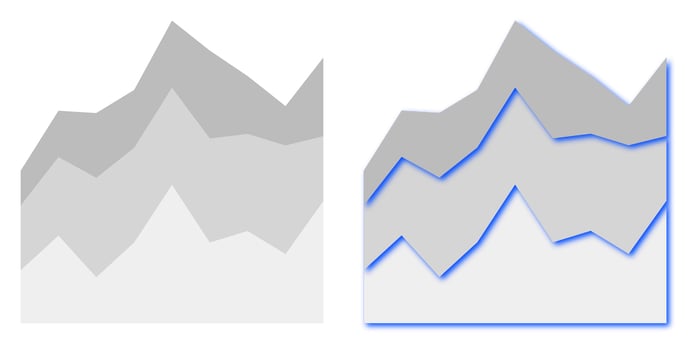
SHADOW
| Shadow |
Available in Datylon web app only. Adds shadow to a given element. Color, X and Y offset and Blur are available for editing. |
 |
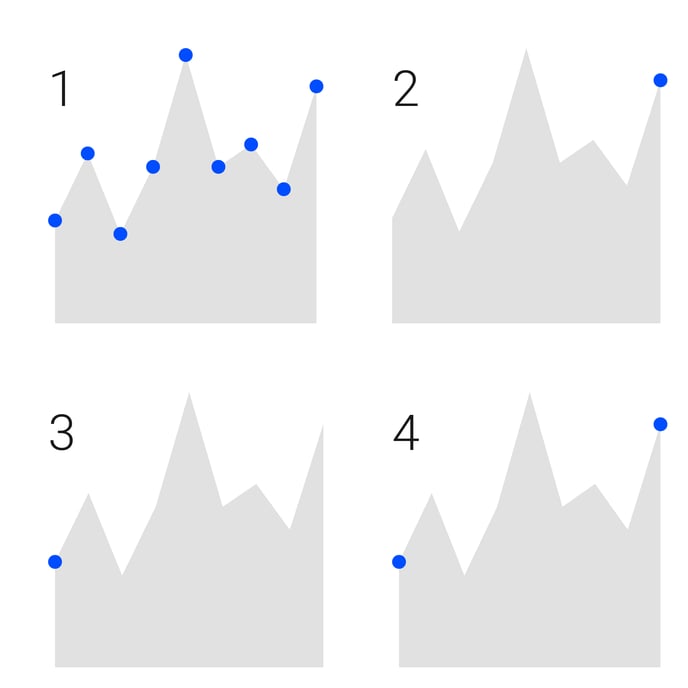
Data Marks>
| Show |
Sets the location(s) of data marks:
|
 |
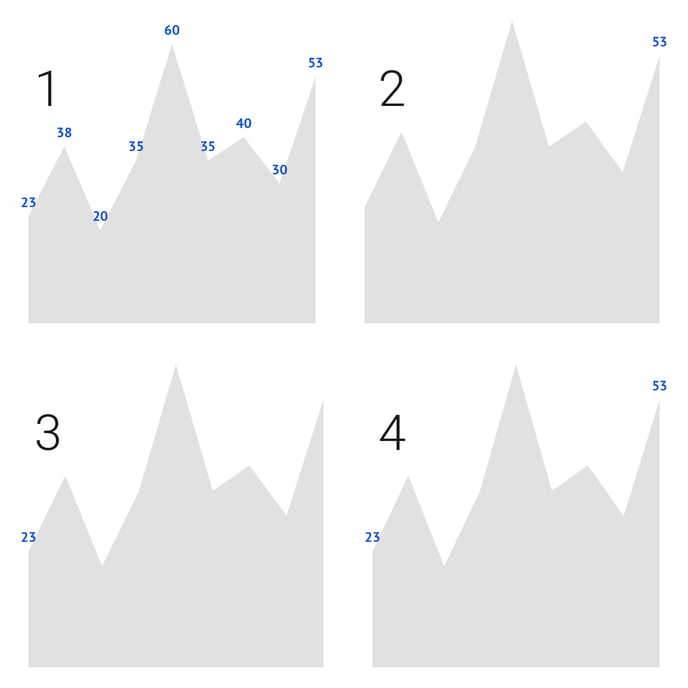
Data Labels>
| Show |
Sets the location(s) of data labels:
|
 |
| Data Mark Anchor |
Can only be applied when data marks are shown. Moves the center of the text box to the selected position of data mark: Center, Center Left, Center Right, Top, Top Left, Top Right, Bottom, Bottom Left, Bottom Right |
 |
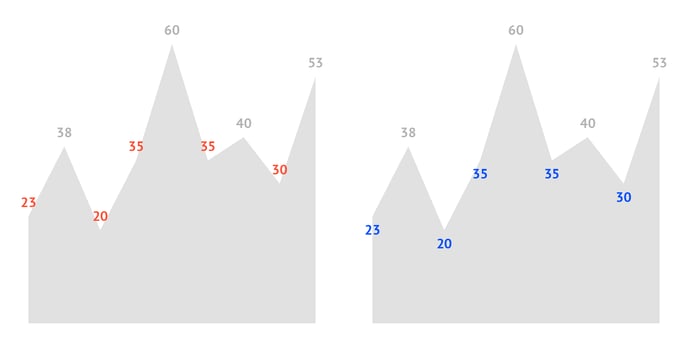
| Smart Labels |
Positions the labels above or below the line (left or right the line in case of a vertical chart orientation), depending on the line's inclination. The distance of the label from the line is set by Vertical Offset (or Horizontal Offset in case of a vertical chart orientation). |
|
| Horizontal Alignment | Aligns the label left, centered or right relative to the data point or relative to the data mark anchor if data marks are shown. | 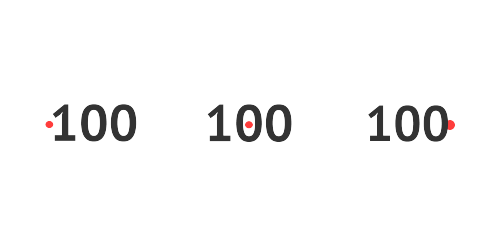 |
| Vertical Alignment | Aligns the label top, centered, or bottom relative to the data point or relative to the data mark anchor if data marks are shown. | 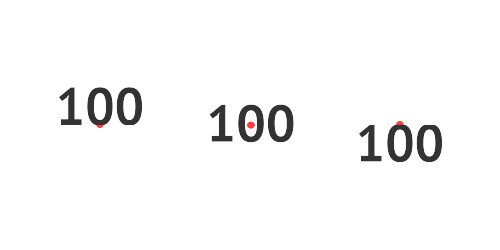 |
| Horizontal Offset | Sets the position of the label horizontally. Enter a positive value to move to the right. Enter a negative value to move to the left. |  |
| Vertical Offset | Sets the position of the label vertically. Enter a positive value to move up. Enter a negative value to move down. |  |
| Rotation |
Rotates the label around the anchor point. A positive value rotates counterclockwise. A negative value clockwise. |
 |
| Prefix |
Adds a prefix to all legend labels. Consecutive spaces are ignored. |
 |
| Suffix |
Adds a suffix to all legend labels. Consecutive spaces are ignored. |
 |
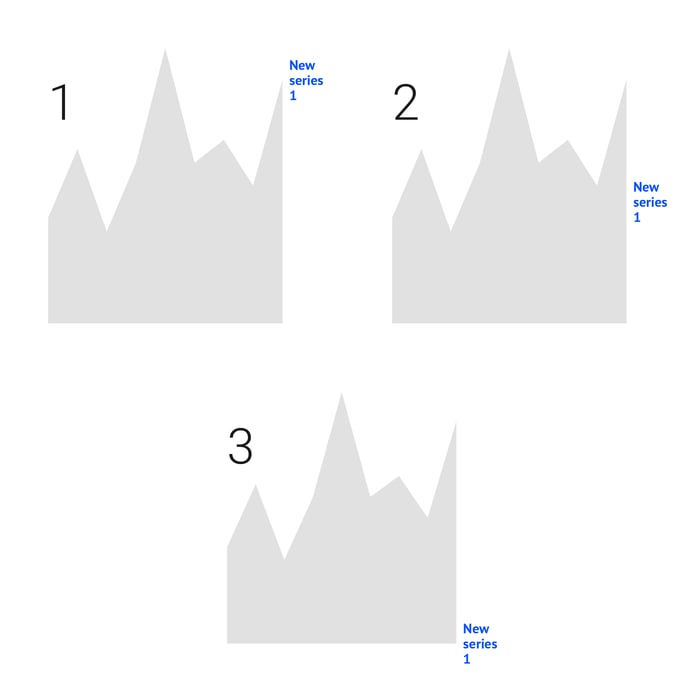
Direct Labels>
| Location |
Sets the location(s) of the direct labels:
|
 |
| Smart Labels | Automatically repositions direct labels if multiple labels overlap. | 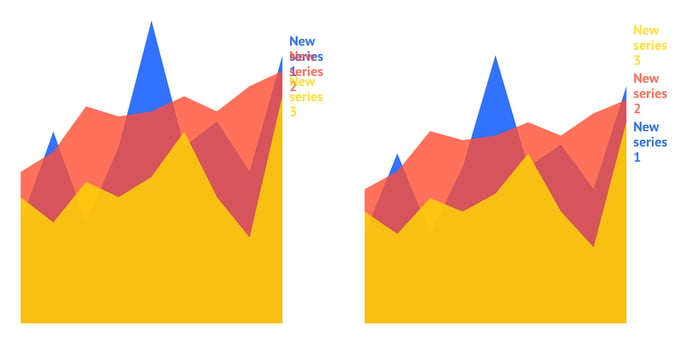 |
| Horizontal Alignment | Aligns the label left, centered, or right relative to the data point or relative to the data mark anchor if data marks are shown. | |
| Vertical Alignment | Aligns the label top, centered, or bottom relative to the data point or relative to the data mark anchor if data marks are shown. | |
| Horizontal Offset | Sets the position of the label horizontally. Enter a positive value to move to the right. Enter a negative value to move to the left. | |
| Vertical Offset | Changes the position of the label vertically. Enter a positive value to move to the top. Enter a negative value to move to the bottom. | |
| Rotation |
Rotates the label around the anchor point. A positive value rotates counterclockwise. A negative value clockwise. |
|
| Prefix | Adds a prefix to the labels. | |
| Suffix | Adds a suffix to the labels. | |